Published: 2026-06-25T01:57:02.000Z
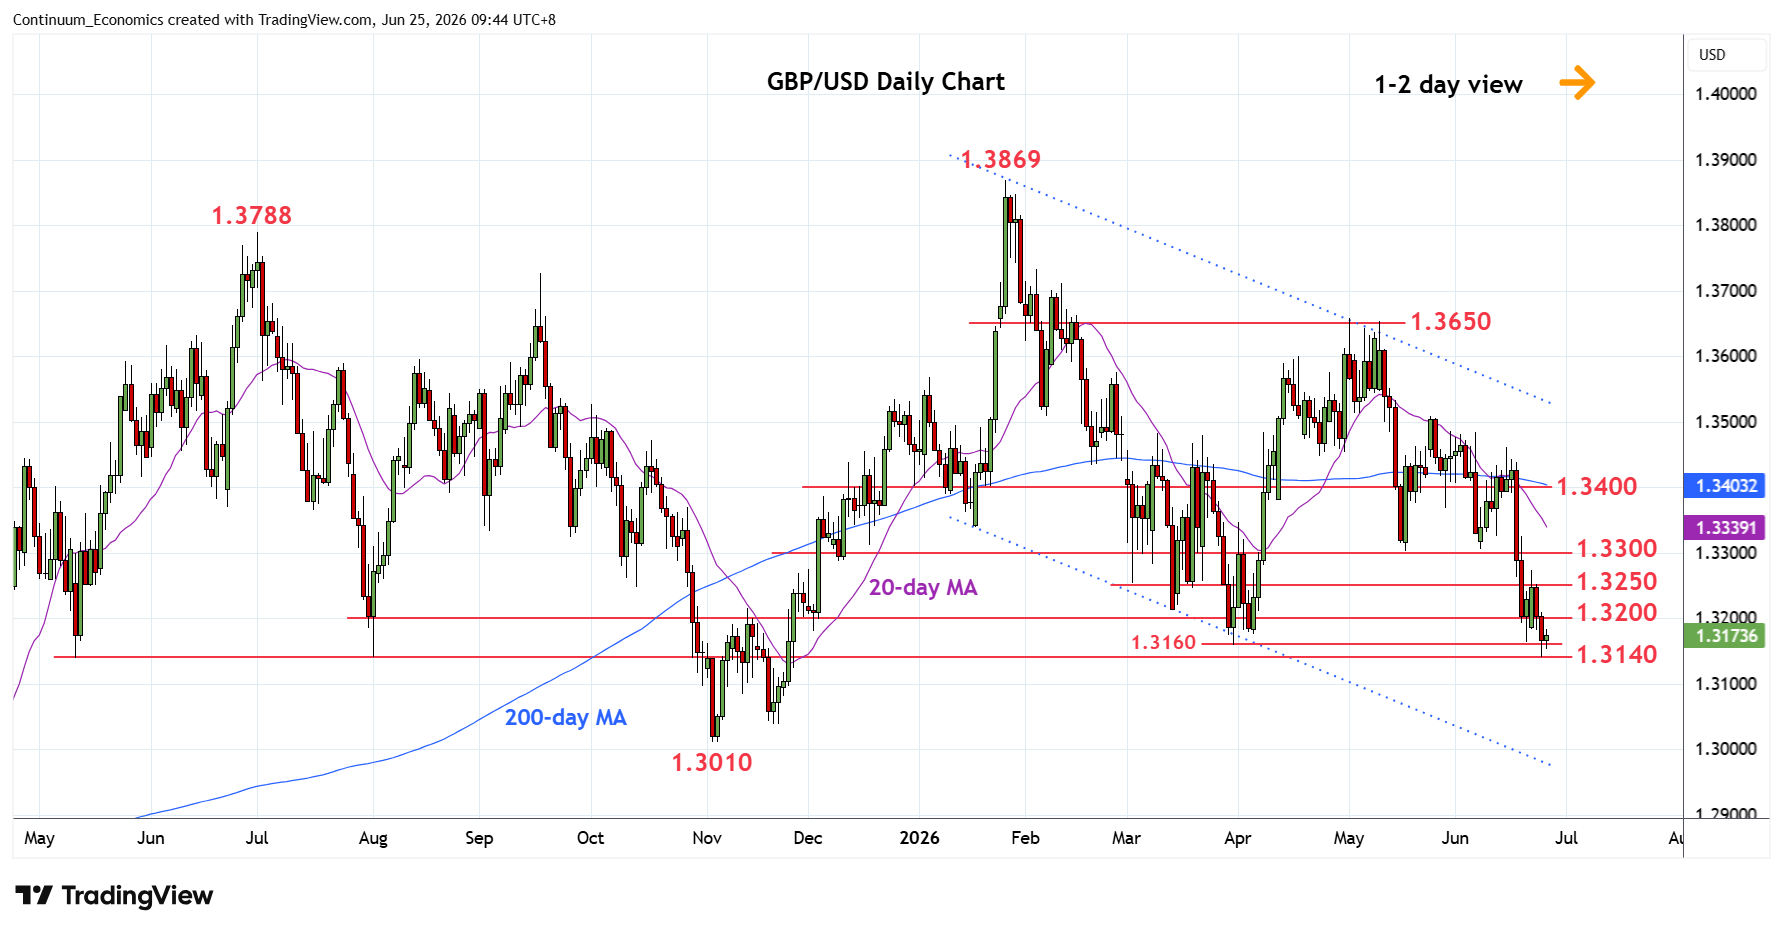
Chart GBP/USD Update: Consolidating at 1.3140 fresh year low
3
Break of the 1.3160 March low saw losses to fresh year low at 1.3140 before turning up to consolidate sharp losses last week
| Level | Comment | Level | Comment | |||||
|---|---|---|---|---|---|---|---|---|
| R4 | 1.3400 | * | congestion | S1 | 1.3160 | * | Mar low | |
| R3 | 1.3350 | congestion | S2 | 1.3140 | ** | 24 Jun YTD low | ||
| R2 | 1.3300 | ** | congestion, May low | S3 | 1.3100 | * | congestion | |
| R1 | 1.3200/50 | * | congestion | S4 | 1.3010 | ** | 4 Nov low |
Asterisk denotes strength of level
02:00 GMT - Break of the 1.3160 March low saw losses to fresh year low at 1.3140 before turning up to consolidate sharp losses last week. Intraday and daily studies are unwinding oversold readings and suggest scope for corrective bounce with resistance starting at 1.3200/50 congestion area. Only above here will open up room for stronger recovery to resistance at the 1.3300 May low. Meanwhile, break of the 1.3140 low will see room to further extend the January losses to 1.3100 congestion. Lower still, if seen, will turn focus to 1.3010, November low.