Published: 2026-06-22T00:41:04.000Z
Chart NZD/USD Update: Still heavy, room to .5700/.5680 support
-
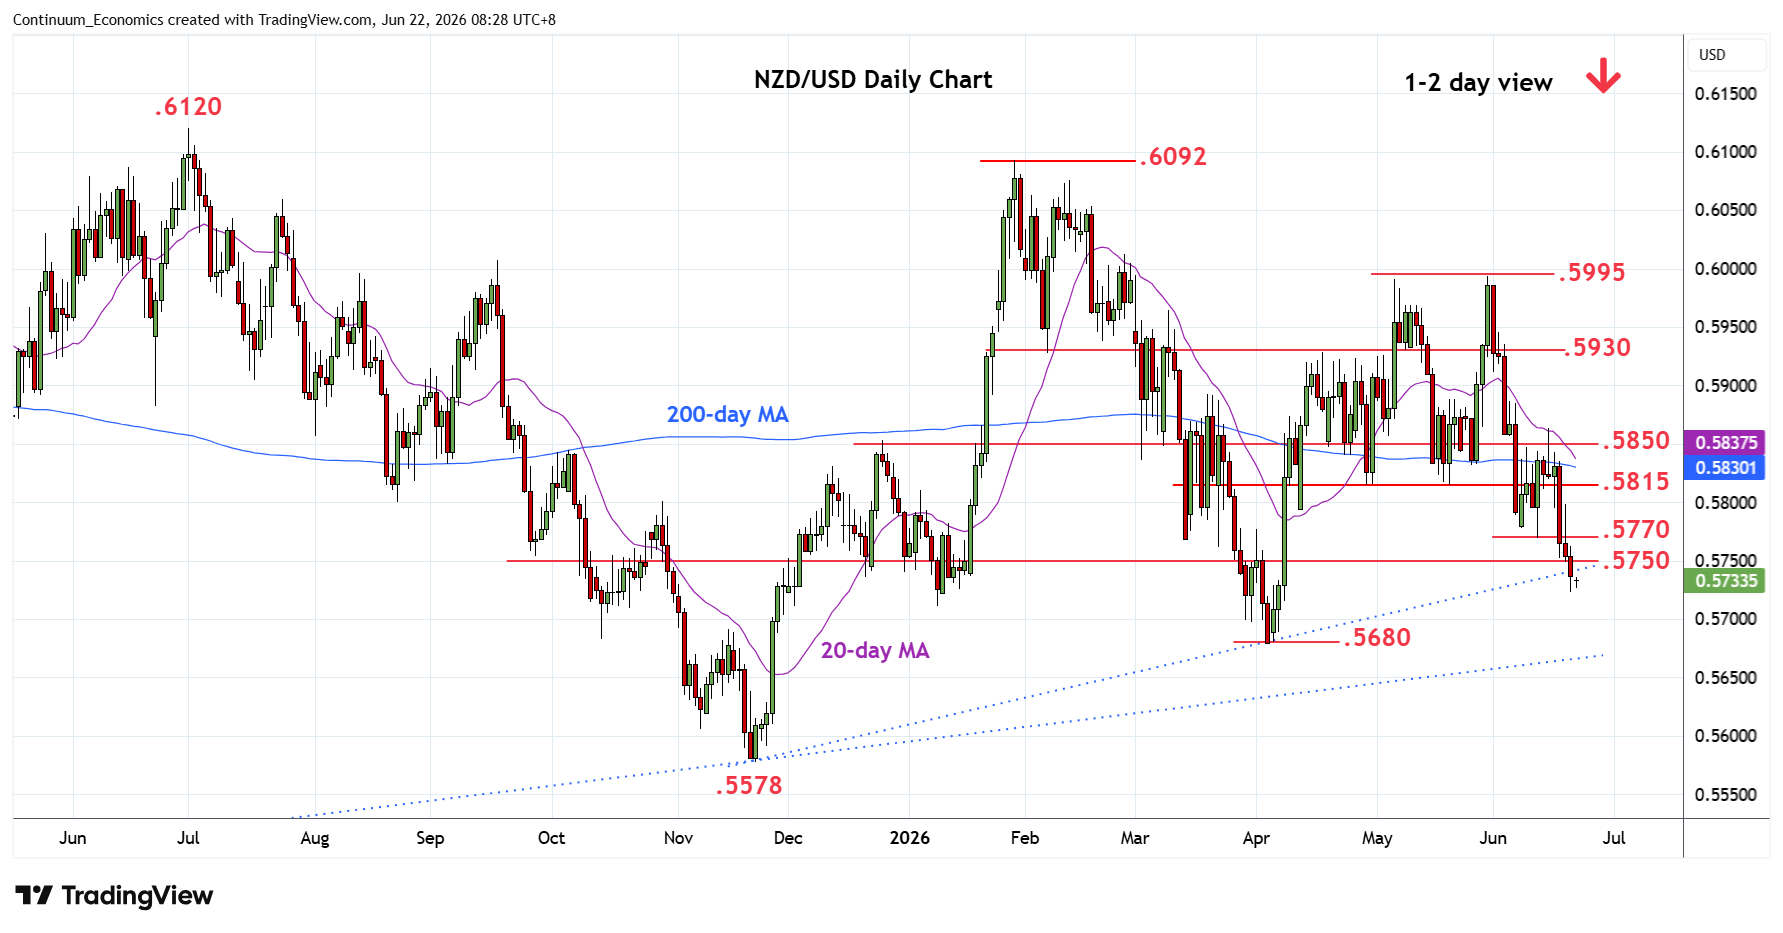
Break of the .5750/40 congestion and trendline support from the November low has seen losses to reach .5720 low
| Levels | Imp | Comment | Levels | Imp | Comment | |||
|---|---|---|---|---|---|---|---|---|
| R4 | .5865 | * | 15 Jun high | S1 | .5720 | * | 19 Jun low | |
| R3 | .5850 | * | congestion | S2 | .5700 | * | Mar low, congestion | |
| R2 | .5800/15 | ** | congestion, May low | S3 | .5680 | ** | 3 Apr YTD low | |
| R1 | .5770 | 11 Jun low | S4 | .5650 | * | congestion |
Asterisk denotes strength of level
00:30 GMT - Break of the .5750/40 congestion and trendline support from the November low has seen losses to reach .5720 low. Negative daily and weekly studies keeps pressure on the downside and suggest consolidation here giving way to fresh selling interest later. Lower will extend the May losses and see room to the .5700 level then the .5680 April current year low where reaction can be expected. Meanwhile, resistance is at the .5770 low of 11 June and extend to the .5800/15 congestion and May low. Above the latter needed to ease the downside pressure.