Published: 2026-09-14T00:31:51.000Z
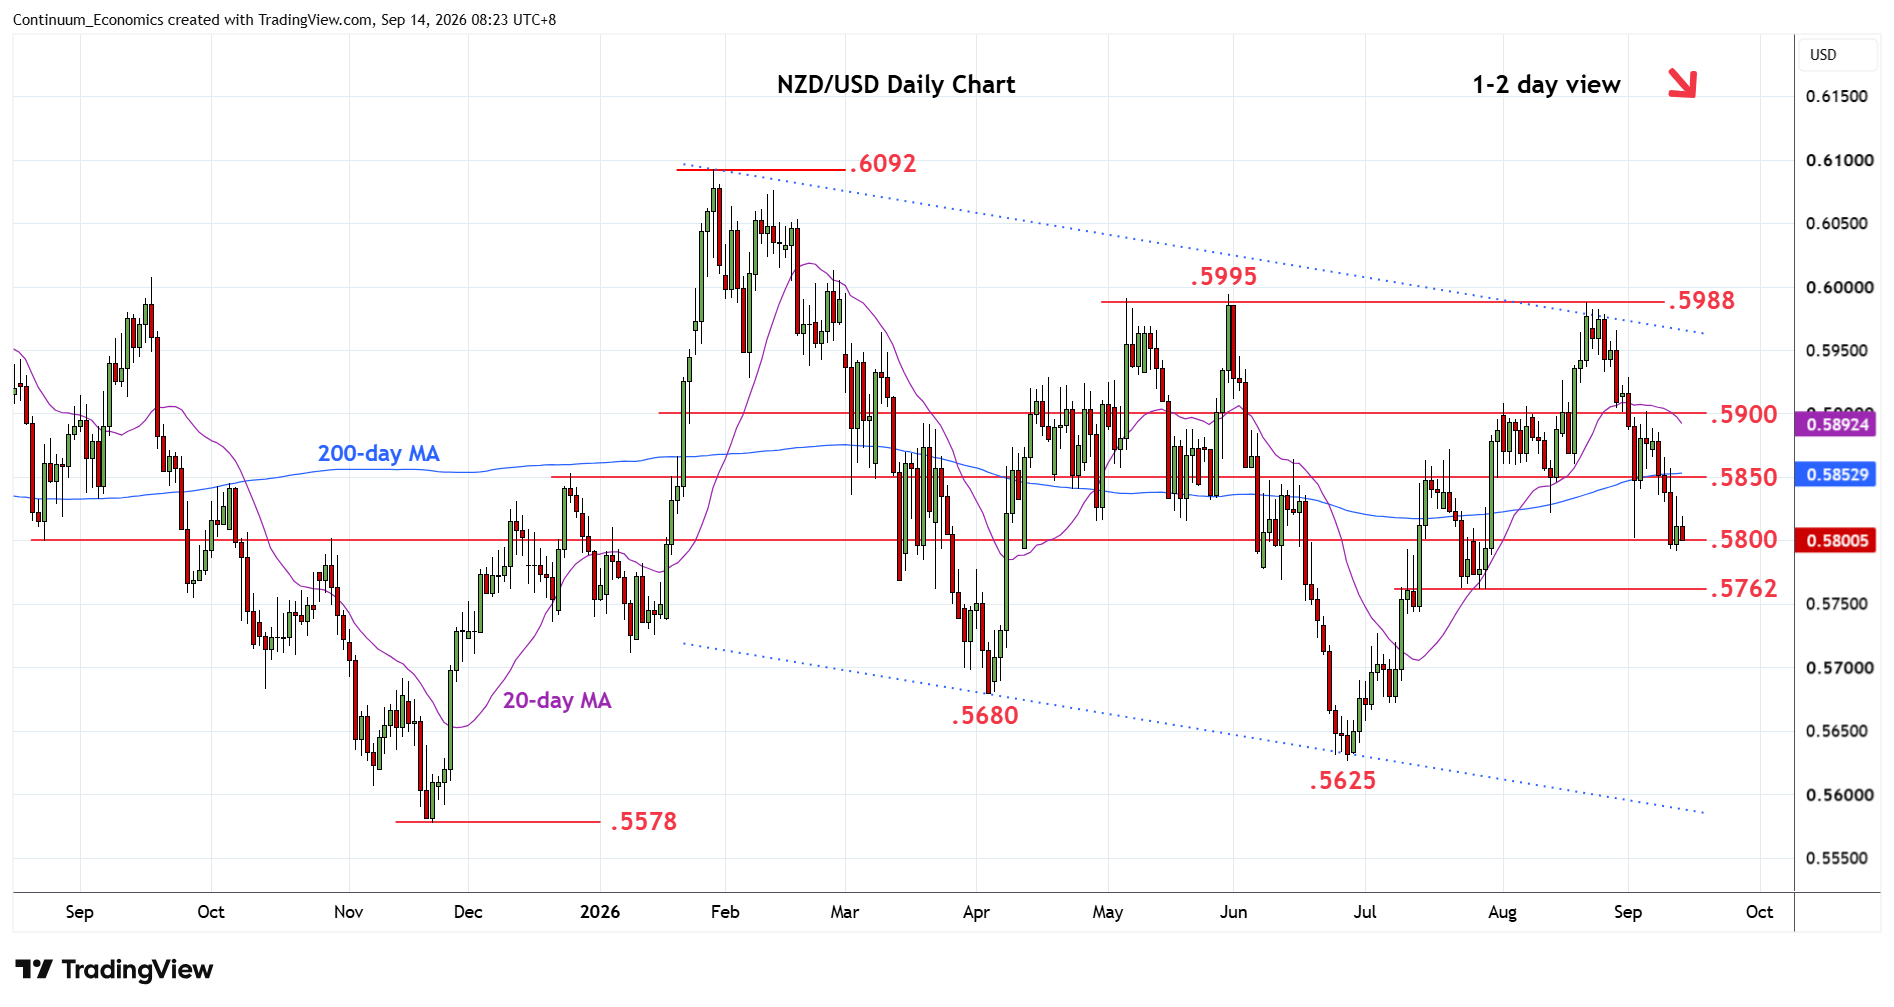
Chart NZD/USD Update: Consolidating at .5800, but still heavy
4
Little change, as prices consolidate around the .5800 level, having edged up from the .5790 low of last week
| Levels | Imp | Comment | Levels | Imp | Comment | |||
|---|---|---|---|---|---|---|---|---|
| R4 | .5950 | * | congestion | S1 | .5800 | * | congestion | |
| R3 | .5930 | * | 1 Sep high | S2 | .5762 | * | 23 Jul low, 61.8% | |
| R2 | .5900 | ** | congestion | S3 | .5750 | * | congestion | |
| R1 | .5850 | * | congestion | S4 | .5700 | * | congestion |
Asterisk denotes strength of level
00:30 GMT - Little change, as prices consolidate around the .5800 level, having edged up from the .5790 low of last week to unwind oversold intraday studies. However, negative daily and weekly studies suggest this giving way to renewed selling pressure later and see deeper pullback to retrace gains from the June low. Lower will see room to the .5762/50, 61.8% Fibonacci level and congestion area. Meanwhile, resistance is lowered to the .5850 congestion which is expected to cap. Would need to regain this to ease the bearish pressure and open up room for consolidation to the .5900 level.