Published: 2026-09-03T00:27:47.000Z
Chart AUD/USD Update: Back in consolidation above .7150
1
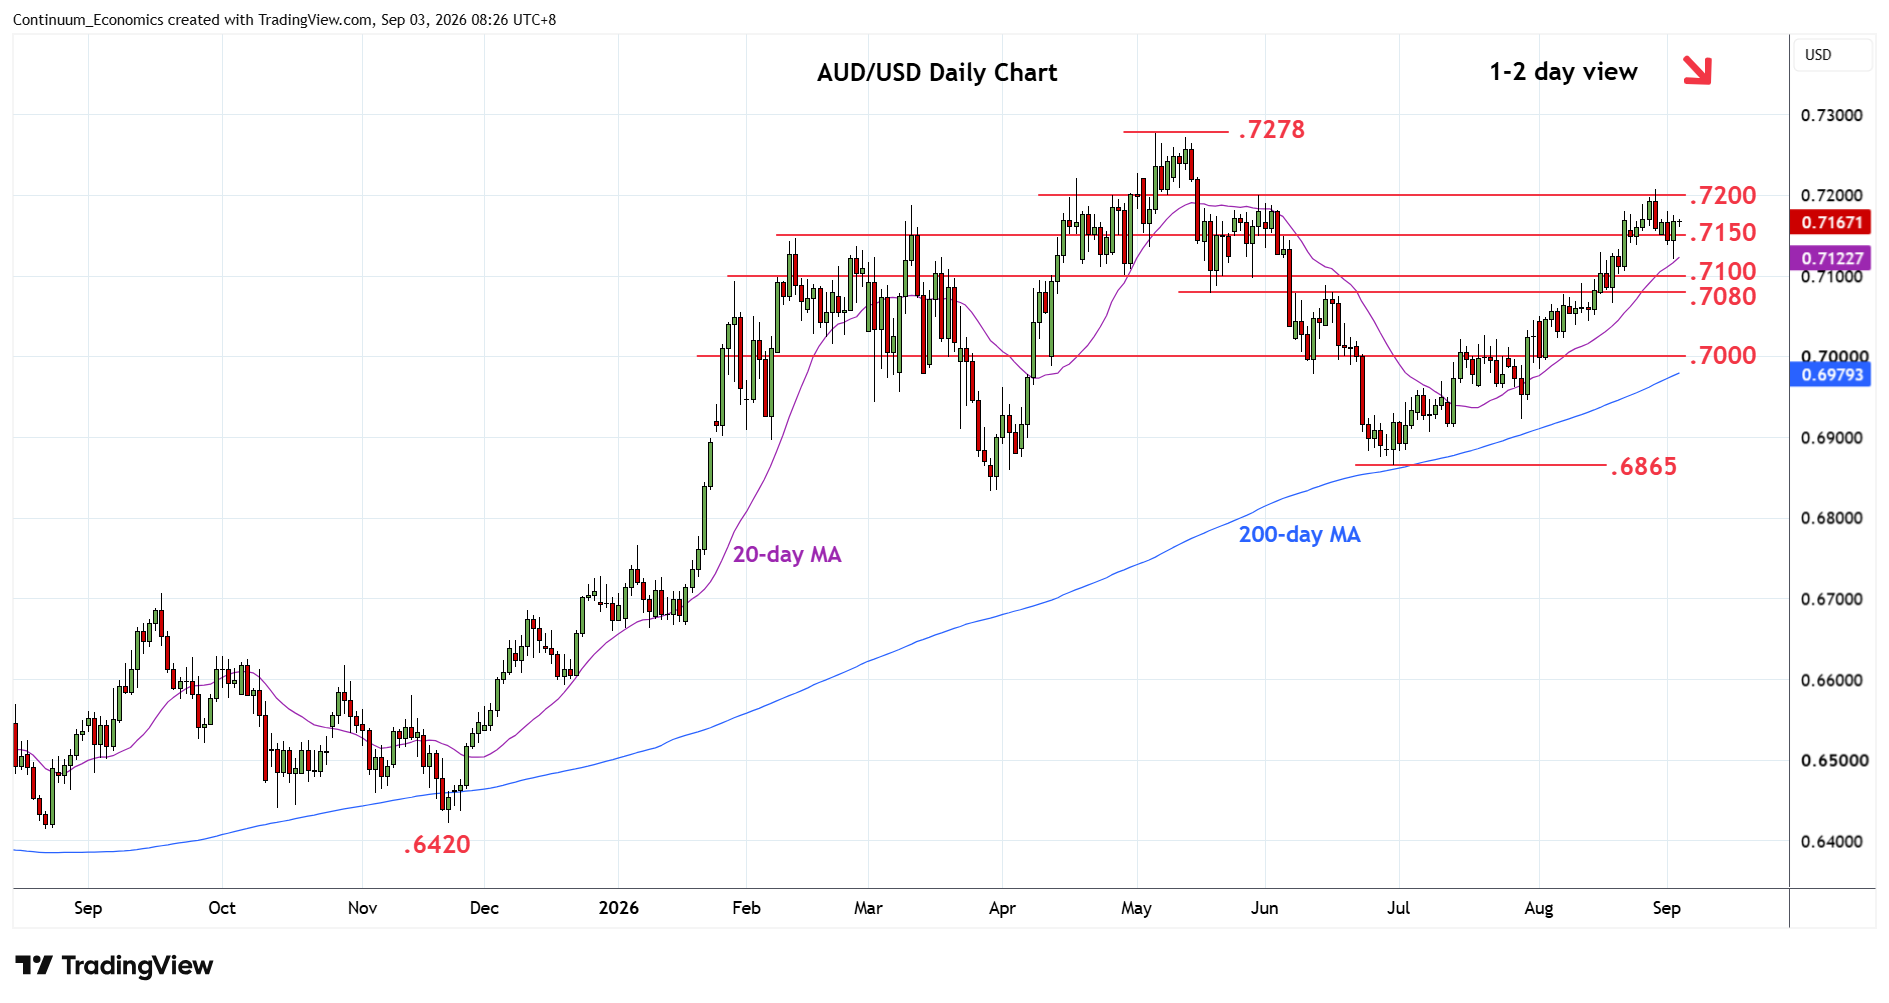
Turned up smartly from the .7120 low to consolidate above the .7150 congestion
| Levels | Imp | Comment | Levels | Imp | Comment | |||
|---|---|---|---|---|---|---|---|---|
| R4 | 0.7300 | * | congestion | S1 | 0.7150 | * | congestion | |
| R3 | 0.7278 | ** | 6 May YTD high | S2 | 0.7100 | * | congestion | |
| R2 | 0.7200/08 | * | congestion, 28 Aug high | S3 | 0.7080 | ** | May low, 38.2% | |
| R1 | 0.7180 | 1 Sep high | S4 | 0.7050 | * | congestion |
Asterisk denotes strength of level
00:20 GMT - Turned up smartly from the .7120 low to consolidate above the .7150 congestion. However, negative daily studies suggest consolidation giving way to fresh selling pressure later. Below the .7150 congestion and .7120 low will threaten further losses to retrace rally from .6865 June low and see room to strong support at .7100./7080 support area and 38.2% Fibonacci level. Meanwhile, resistance is at the .7180 high of Tuesday and this extend to the .7200 congestion. Break above these will turn focus to the .7278, 6 May current year high.