Chart EUR/SEK Update: Choppy trade - background studies turning down
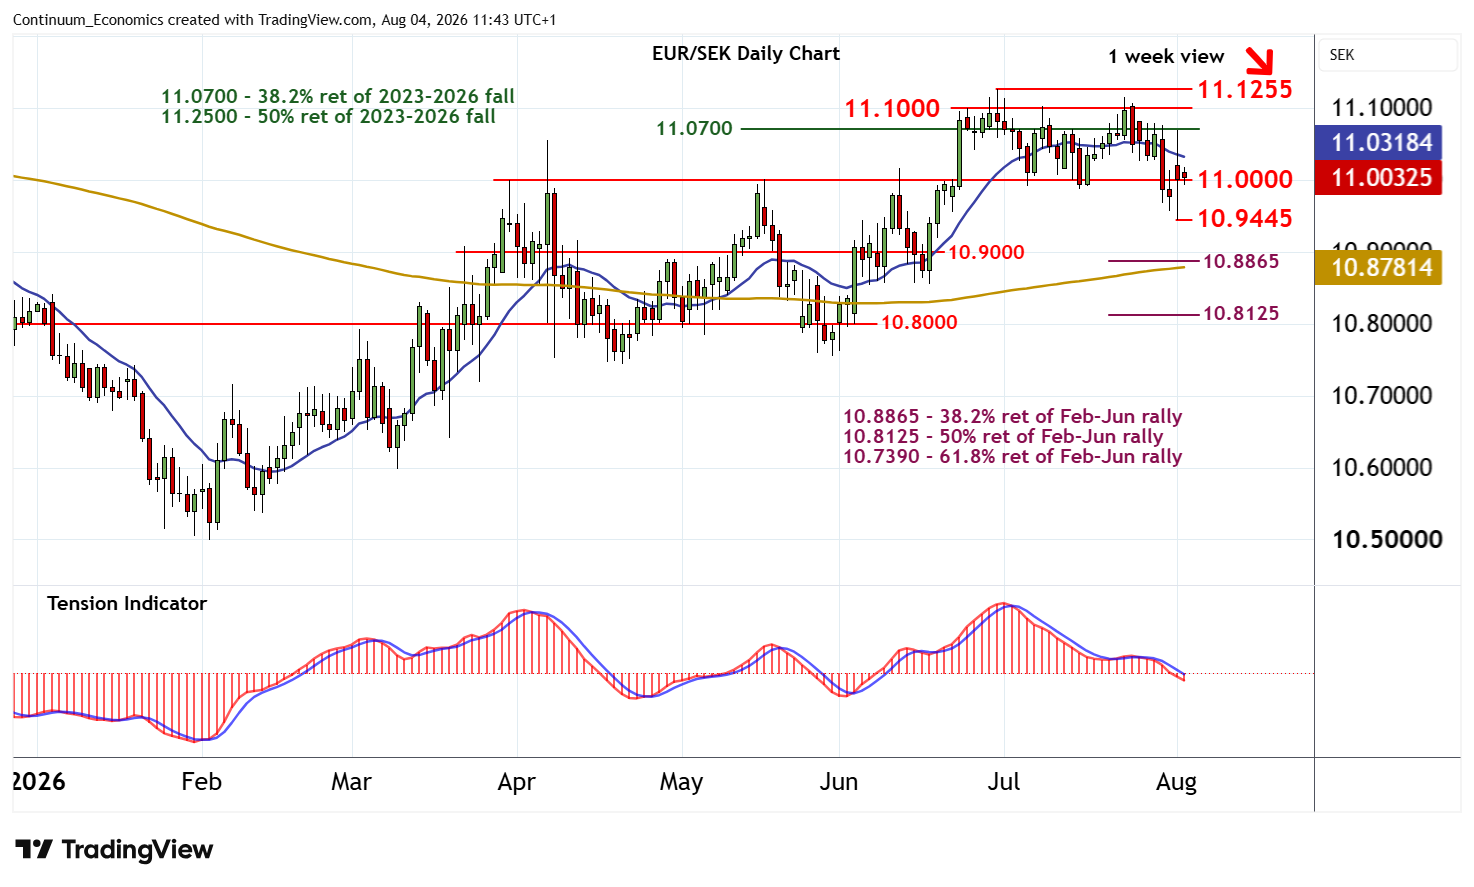
Consolidation beneath the 11.1000 range highs has given way to a pullback to 10.9445
| Levels | Imp | Comment | Levels | Imp | Comment | |||
| R4 | 11.2000 | * | congestion | S1 | 11.0000 | ** | break level | |
| R3 | 11.1500 | * | congestion | S2 | 10.9445 | * | 3 Aug low | |
| R2 | 11.1255 | ** | 30 Jun YTD high | S3 | 10.9000 | * | congestion | |
| R1 | 11.1000 | ** | range highs | S4 | 10.8865 | * | 38.2% ret of Feb-Jun rally |
Asterisk denotes strength of level
11:20 BST - Consolidation beneath the 11.1000 range highs has given way to a pullback to 10.9445, where a fresh bounce has put prices into consolidation above support at 11.0000. Oversold daily stochastics are flattening, suggesting room for cautious trade in the coming sessions. But the daily Tension Indicator is falling and broader weekly charts are coming under pressure, highlighting room for later losses. A close below the 10.9445 low of 3 August will add weight to sentiment and complete a multi-week distribution top beneath the 11.1255 current year high of 30 June. Focus will then turn to congestion around 10.9000 and the 10.8865 Fibonacci retracement. Meanwhile, any renewed tests higher should be limited in range extension beneath 11.1000 - 11.1255.