Published: 2026-11-10T00:34:08.000Z
Chart AUD/USD Update: Consolidating test of .6565/33 support
1
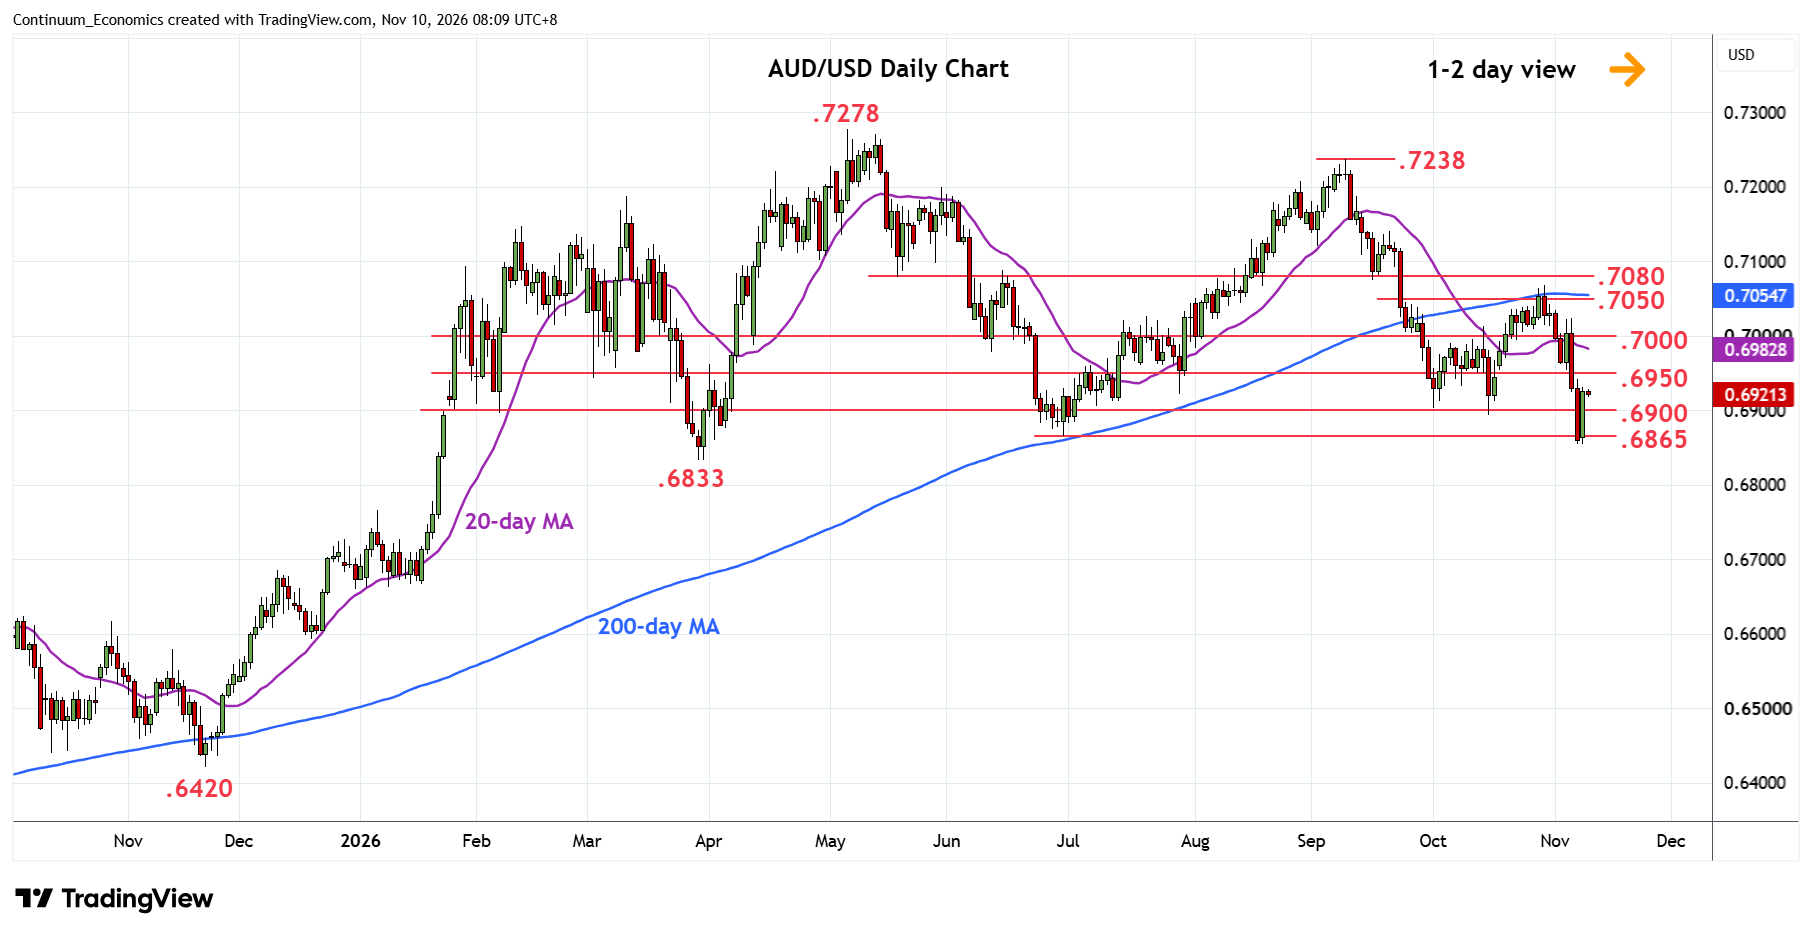
Saw strong bounce from support at the .6865/33 lows as prices prices consolidate losses from the .7068 October high
| Levels | Imp | Comment | Levels | Imp | Comment | |||
|---|---|---|---|---|---|---|---|---|
| R4 | 0.7080 | ** | May low, congestion | S1 | 0.6900 | ** | congestion, channel | |
| R3 | 0.7050/68 | ** | congestion, Oct high | S2 | 0.6865 | ** | Jun low | |
| R2 | 0.7000 | * | congestion | S3 | 0.6833 | ** | Mar low | |
| R1 | 0.6950 | * | congestion | S4 | 0.6800 | * | figure |
Asterisk denotes strength of level
00:20 GMT - Saw strong bounce from support at the .6865/33 lows as prices prices consolidate losses from the .7068 October high and unwind oversold daily studies. Above the .6900 level opens up room for stronger bounce to resistance at the .6950 congestion which is expected to cap. Regaining this will ease the downside pressure and open up room for retest of .7000/.7025 area. Meanwhile, support is raised to the .6900 level. Below here will .6865 and .6833 lows to retest and see room to extend losses from the .7278 May current year high.