Published: 2026-09-24T13:45:56.000Z
Chart AUD/USD Update: Extending September losses
4
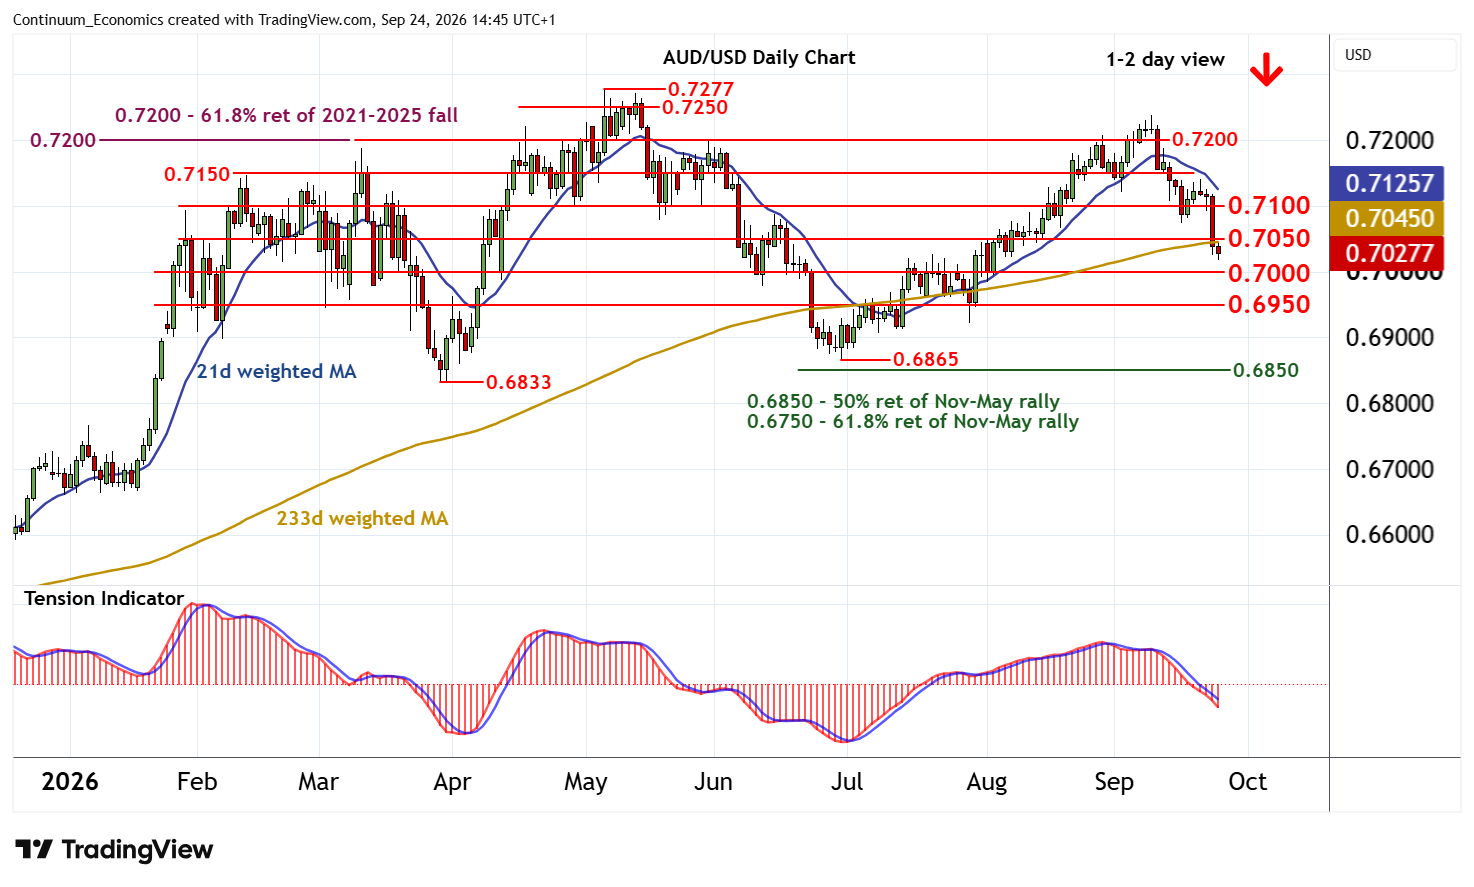
The anticipated break below 0.7050 has reached 0.7020~
| Levels | Imp | Comment | Levels | Imp | Comment | |||
|---|---|---|---|---|---|---|---|---|
| R4 | 0.7200 | ** | congestion | S1 | 0.7000 | * | congestion | |
| R3 | 0.7150 | * | congestion | S2 | 0.6950 | * | break level | |
| R2 | 0.7100 | ** | congestion | S3 | 0.6900 | ** | congestion | |
| R1 | 0.7050 | * | congestion | S4 | 0.6865 | ** | 30 Jun (m) low |
Asterisk denotes strength of level
14:35 BST - The anticipated break below 0.7050 has reached 0.7020~, where mixed/negative intraday studies have prompted choppy trade. Daily readings are under pressure and broader weekly charts continue to deteriorate, highlighting room for still further losses in the coming sessions. A test of congestion support at 0.7000 is looked for, with a further break adding weight to already bearish price action and extending September losses towards 0.6950.
Meanwhile, resistance is lowered to congestion around 0.7050. A close back above here, if seen, would help to stabilise sentiment and prompt consolidation beneath 0.7100.