Published: 2026-06-05T00:28:08.000Z
Chart AUD/USD Update: Leaning lower from the .7200 resistance
2
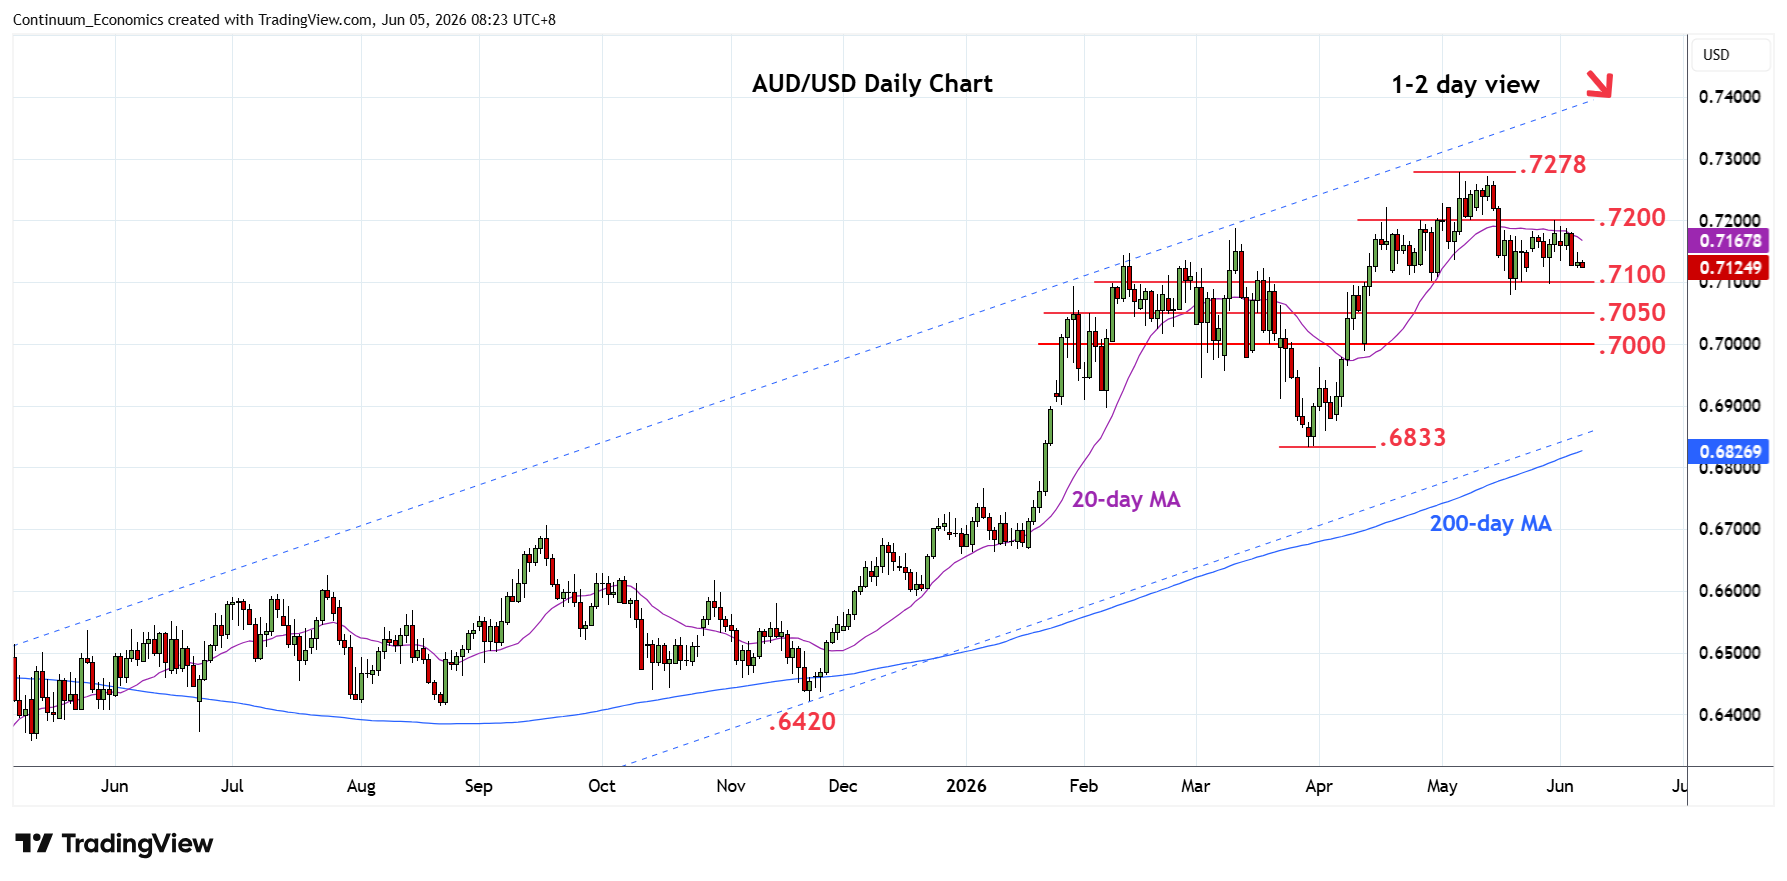
Weighing on the .7120 low following pullback from the .7200 resistance and scope is seen for extension to retest of the .7100 level
| Levels | Imp | Comment | Levels | Imp | Comment | |||
|---|---|---|---|---|---|---|---|---|
| R4 | 0.7400 | ** | congestion | S1 | 0.7100 | ** | congestion | |
| R3 | 0.7300 | * | congestion | S2 | 0.7055 | * | 50% Mar/May rally | |
| R2 | 0.7278 | ** | 6 May YTD high | S3 | 0.7000 | ** | congestion, 61.8% | |
| R1 | 0.7200 | * | congestion | S4 | 0.6950 | * | congestion |
Asterisk denotes strength of level
00:25 GMT - Weighing on the .7120 low following pullback from the .7200 resistance and scope is seen for extension to retest of the .7100 level. The 2-week flag pattern threatens break here and the .7080 May low to open up room for deeper pullback to retrace rally from the .6833 March low. Lower will see extension to support at the .7055/.7000 congestion area as well as 50% and 61.8% Fibonacci retracement. Meanwhile, resistance at the .7200 level is expected to cap. Only above here will clear the way for retest of the .7278 current year high of 6 May.