Published: 2026-05-25T07:30:08.000Z
Chart AUD/NZD Update: Supported at 1.2135/15 lows
1
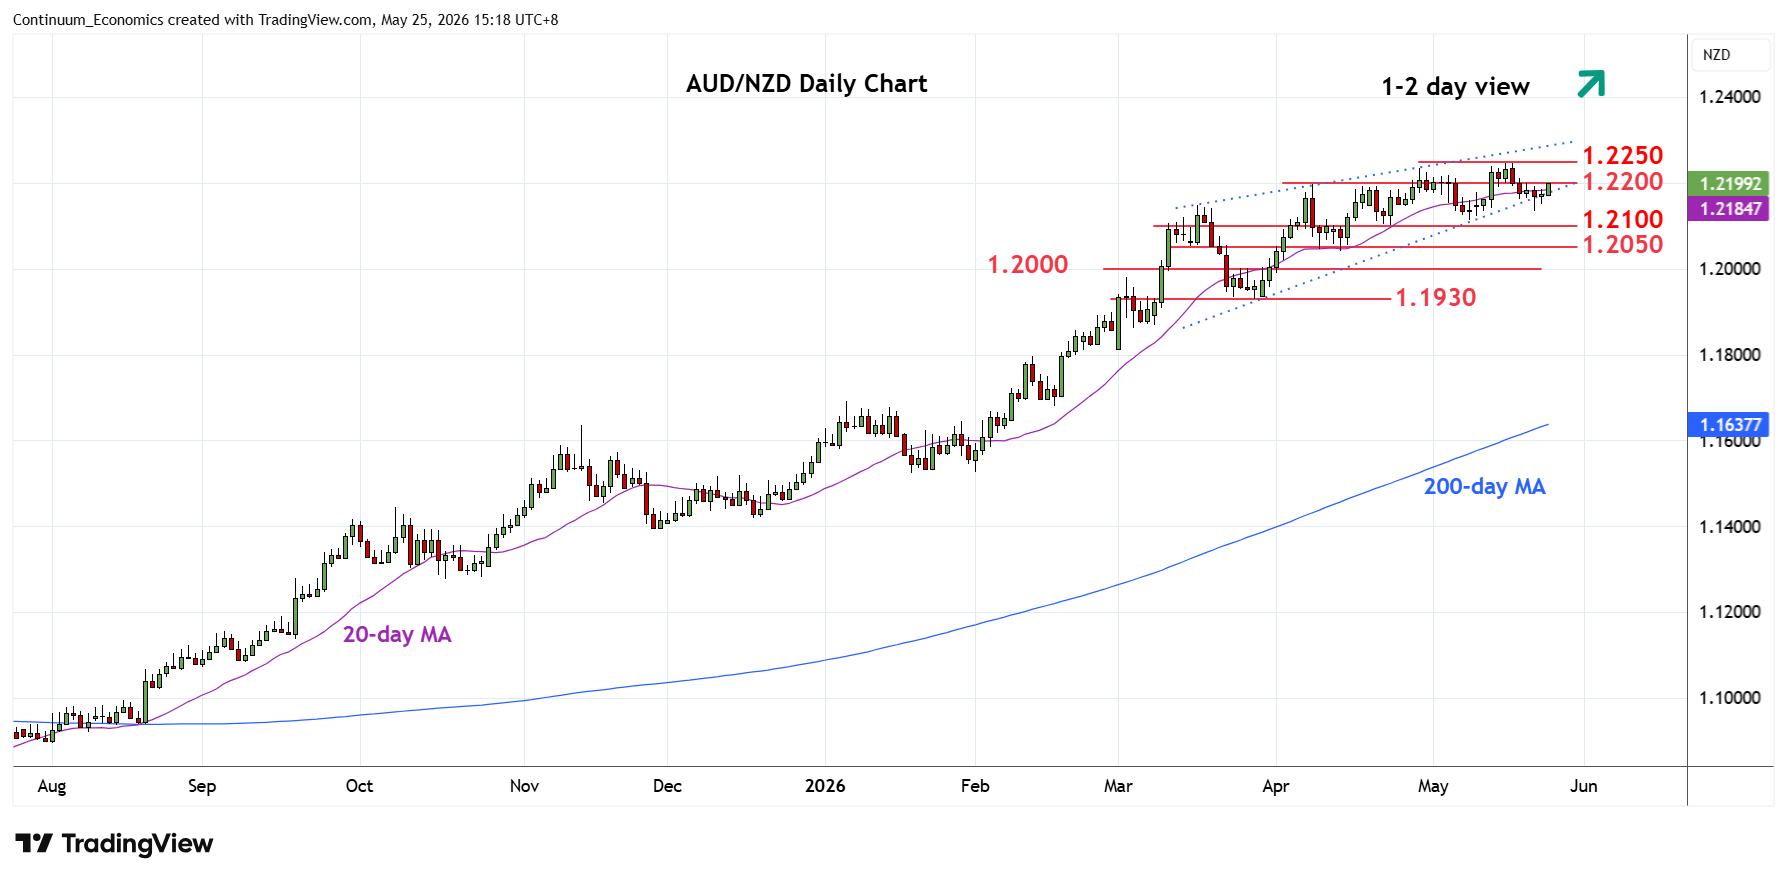
Shallow pullback has given way to bounce to pressure resistance at the 1.2200 level
| Level | Comment | Level | Comment | |||||
|---|---|---|---|---|---|---|---|---|
| R4 | 1.2345 | * | 61.8% 2011/2020 fall | S1 | 1.2135/15 | ** | 21, 8 May lows | |
| R3 | 1.2300/10 | * | congestion, 2011 yr low | S2 | 1.2050 | ** | congestion | |
| R2 | 1.2250 | ** | 15 May YTD high | S3 | 1.2000 | * | congestion | |
| R1 | 1.2200 | * | congestion | S4 | 1.1930 | ** | 27 Mar low |
Asterisk denotes strength of level
07:30 GMT - Shallow pullback has given way to bounce to pressure resistance at the 1.2200 level. Clearance here will expose the 15 May current year high at 1.2250 to retest and see scope to extend bullish gains from the April 2025 year low. Higher will see room to the 1.2300/10 congestion and 1.2345, 61.8% Fibonacci level. Meanwhile support at the 1.2135/15 recent lows should underpin. Would take break here and the 1.2100 level to open up room for deeper pullback to strong support at the 1.2050/00 area and the 1.1930 low of 27 March.