Published: 2026-10-16T13:57:34.000Z
Chart AUD/USD Update: Choppy trade - studies under pressure
1
The anticipated break below congestion support at 0.6900 has not been seen
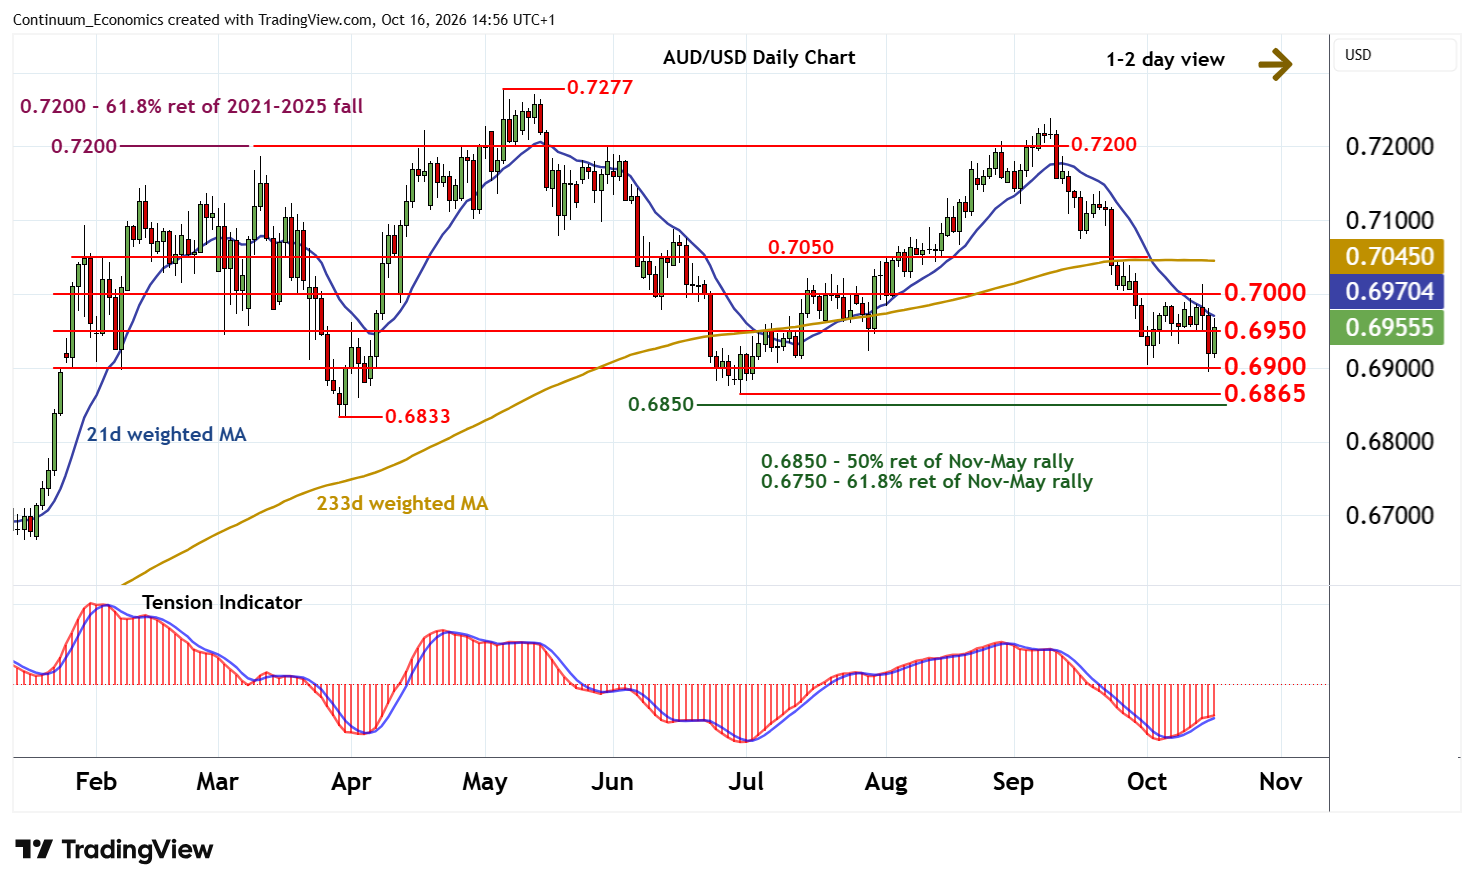
| Levels | Imp | Comment | Levels | Imp | Comment | |||
|---|---|---|---|---|---|---|---|---|
| R4 | 0.7100 | ** | congestion | S1 | 0.6900 | ** | congestion | |
| R3 | 0.7050 | * | congestion | S2 | 0.6865 | ** | 30 Jun (m) low | |
| R2 | 0.7000 | * | congestion | S3 | 0.6850 | ** | 50% ret of Nov-May rally | |
| R1 | 0.6950 | * | break level | S4 | 0.6833 | ** | 30-31 Mar (m) low |
Asterisk denotes strength of level
14:50 BST - The anticipated break below congestion support at 0.6900 has not been seen, with prices bouncing back to 0.6950 as oversold intraday studies unwind. A test above here cannot be ruled out. But mixed/negative daily readings and bearish weekly charts should limit scope in renewed selling interest towards congestion around 0.7000.
Following cautious/corrective trade, fresh losses are looked for. A later break below 0.6900 will target strong support at 0.6865 monthly low of 30 June. But a further close below the 0.6833 - 0.6850 range will complete a multi-month distribution top and extend May 2026 losses initially to 0.6800.