Published: 2026-06-18T07:34:08.000Z
Chart GBP/USD Update: Consolidating sharp losses - studies under pressure
4
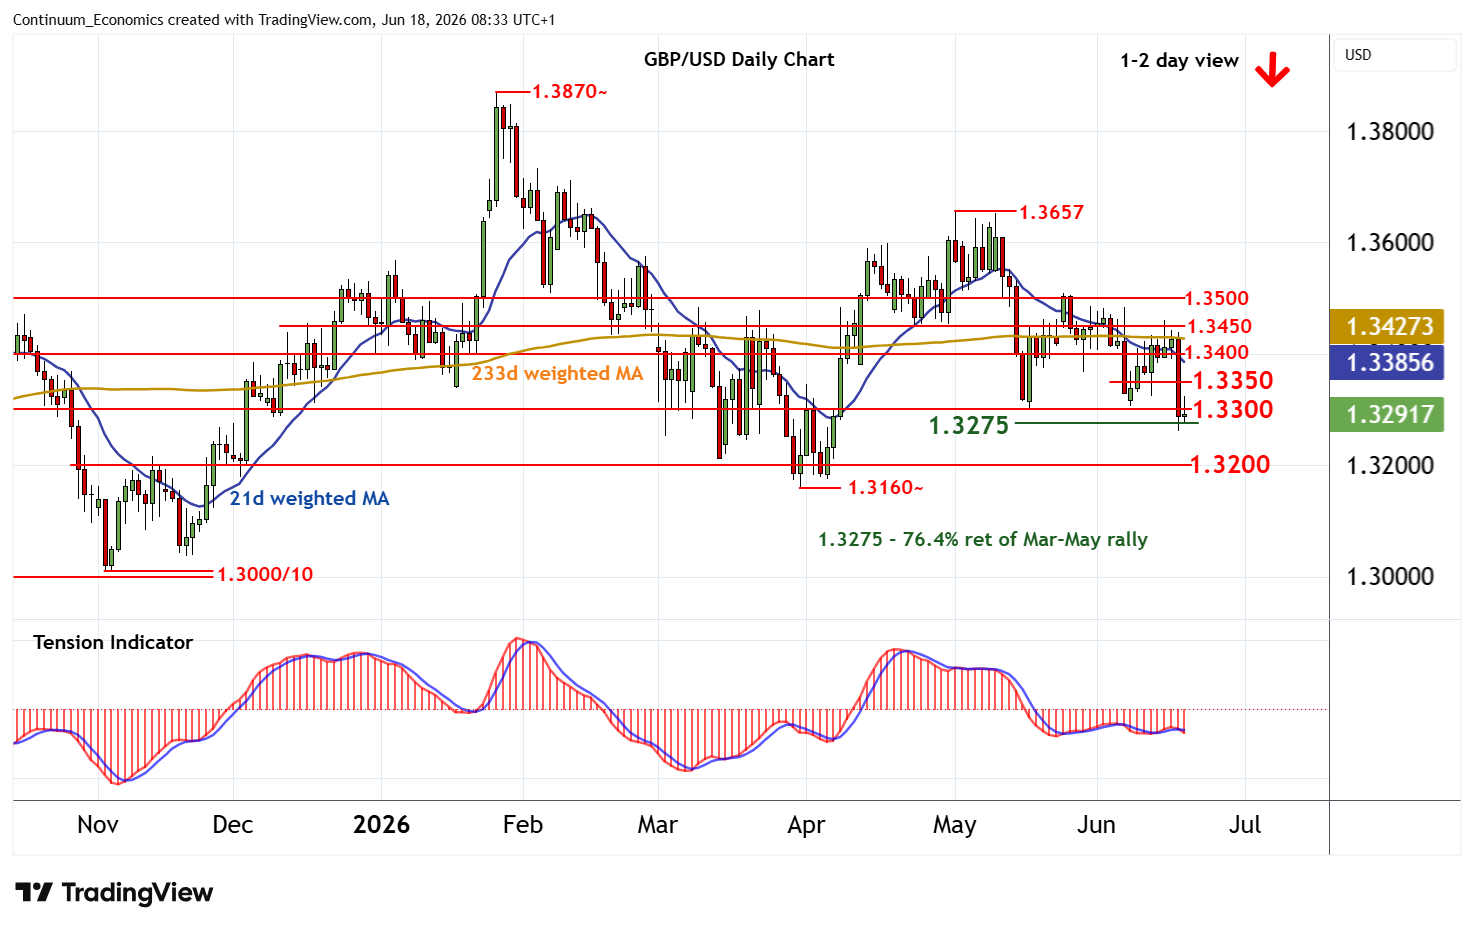
Anticipated losses have proven swifter than expected
| Level | Comment | Level | Comment | |||||
|---|---|---|---|---|---|---|---|---|
| R4 | 1.3450 | break level | S1 | 1.3275 | ** | 76.4% ret of Mar-May rally | ||
| R3 | 1.3400 | ** | congestion | S2 | 1.3200 | ** | congestion | |
| R2 | 1.3350 | break level | S3 | 1.3160~ | ** | 31 Mar YTD low | ||
| R1 | 1.3300 | ** | congestion | S4 | 1.3100 | * | congestion |
Asterisk denotes strength of level
08:10 BST - Anticipated losses have proven swifter than expected, with sharp selling interest reaching strong support at the 1.3275 Fibonacci retracement. Unwinding oversold intraday studies are prompting short-term consolidation above here. But daily readings have turned bearish and broader weekly charts remain under pressure, highlighting room for further losses in the coming sessions. A close below 1.3275 will add weight to sentiment and extend May losses initially towards congestion around 1.3200. Meanwhile, resistance is at congestion around 1.3300. A close above here would help to stabilise price action and prompt consolidation beneath 1.3350.