Published: 2026-11-11T00:30:57.000Z
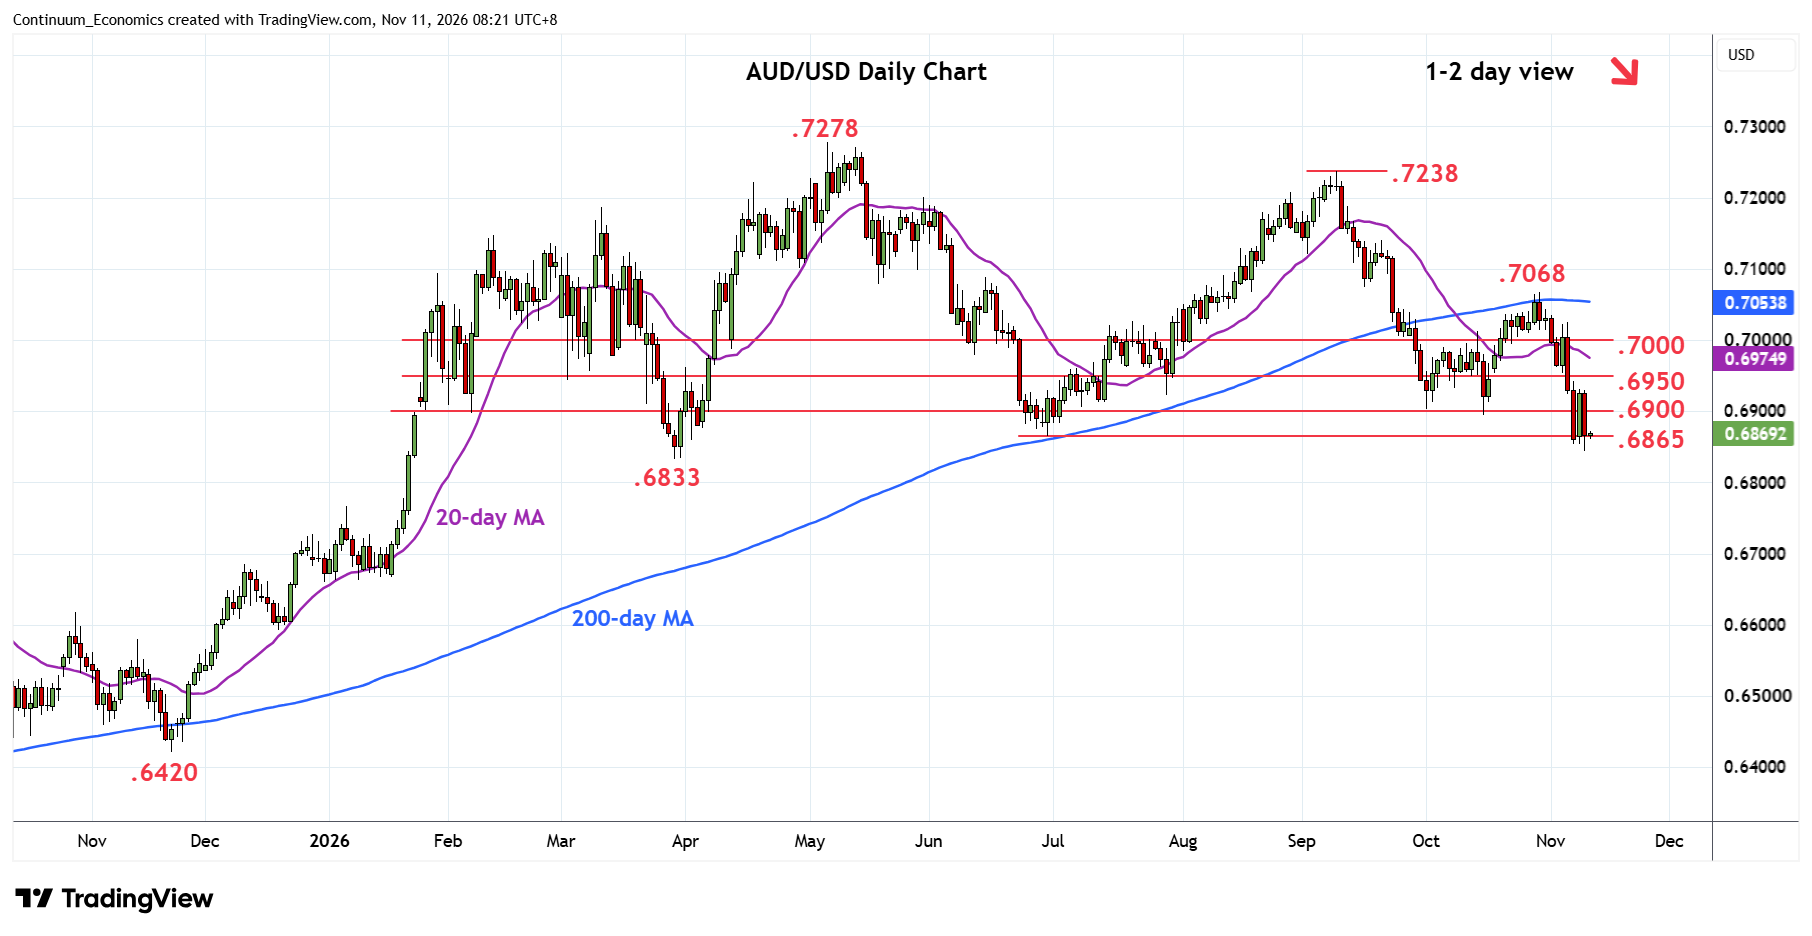
Chart AUD/USD Update: Weighing on .6565/33 support
1
Choppy trade see prices back to pressure support at the .6865/33, June and March lows
| Levels | Imp | Comment | Levels | Imp | Comment | |||
|---|---|---|---|---|---|---|---|---|
| R4 | 0.7080 | ** | May low, congestion | S1 | 0.6865 | ** | Jun low | |
| R3 | 0.7050/68 | ** | congestion, Oct high | S2 | 0.6833 | ** | Mar low | |
| R2 | 0.7000 | * | congestion | S3 | 0.6800 | * | figure | |
| R1 | 0.6950 | * | congestion | S4 | 0.6755 | * | 38.2% 2025/2026 rally |
Asterisk denotes strength of level
00:20 GMT - Choppy trade see prices back to pressure support at the .6865/33, June and March lows. Oversold daily studies suggest consolidation here likely before push lower to extend losses from the .7278 May current year high. Lower will see room to retrace rally from the April 2025 year low to the .6800 level then .6755, 38.2% Fibonacci level. Meanwhile resistance remains at the .6900/.6950 congestion area which is expected to cap. Regaining these will ease the downside pressure and open up room for retest of .7000/.7025 area