Published: 2026-09-10T01:05:48.000Z
Chart EUR/JPY Update: Range-bound from 177.85, fresh year low
2
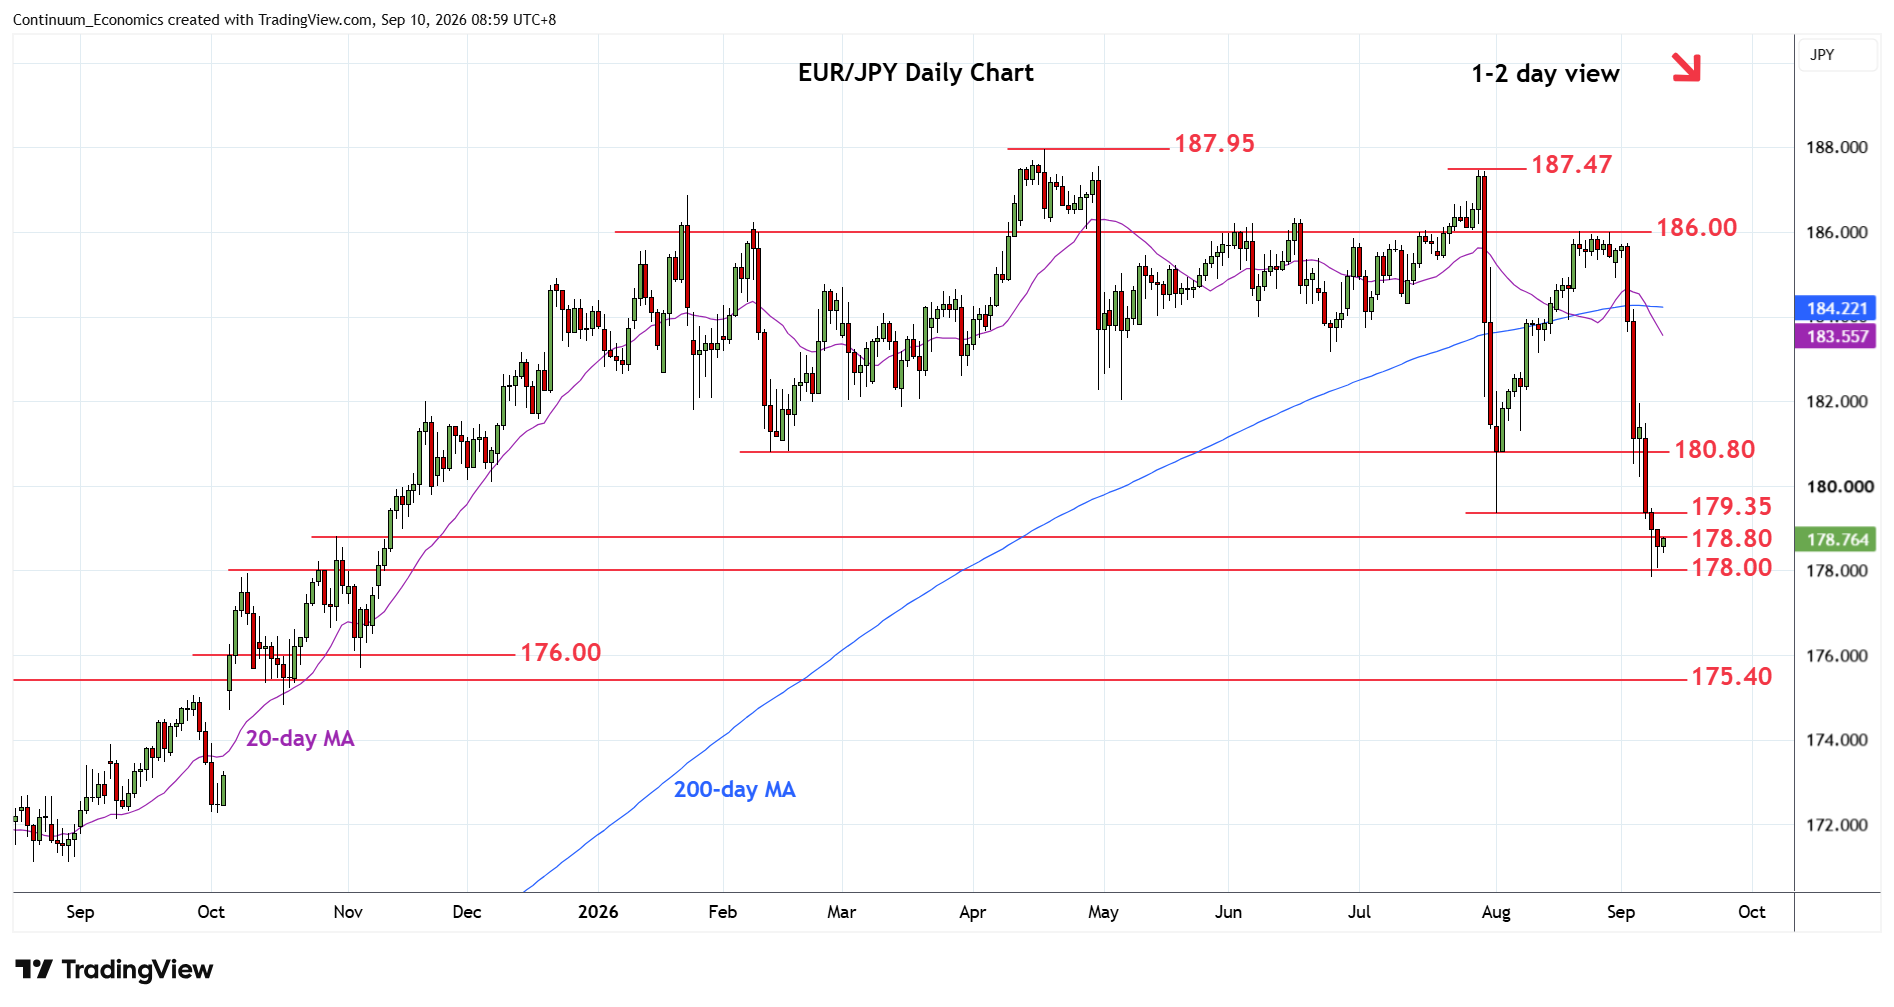
Turned up in range from fresh year low at 177.85 as prices unwind oversold intraday and daily studies
| Levels | Imp | Comment | Levels | Imp | Comment | |||
|---|---|---|---|---|---|---|---|---|
| R4 | 182.00 | ** | May low | S1 | 177.85 | ** | 8 Sep YTD low | |
| R3 | 180.80 | ** | Feb low | S2 | 177.00 | * | congestion | |
| R2 | 180.00 | ** | figure, congestion | S3 | 176.00 | * | congestion | |
| R1 | 179.35 | * | Aug low | S4 | 175.40/30 | ** | 2024 yr high, 38.2% |
Asterisk denotes strength of level
01:00 GMT - Turned up in range from fresh year low at 177.85 as prices unwind oversold intraday and daily studies and consolidate recent sharp losses from the 186.00 level. However, bearish momentum keep focus on the downside and see room for further losses to retrace gains from the February 2025 year low and see room to the 177.00/176.00 congestion area. Below here, will turn focus to support at 175.40/30, 2024 year high and 38.2% Fibonacci level. Meanwhile, resistance is lowered to the 179.35 low of August and extending to the 180.00 figure, now expected to cap and sustain losses from the 186.00 high.