Chart USD/ZAR Update: Any pullback to remain limited
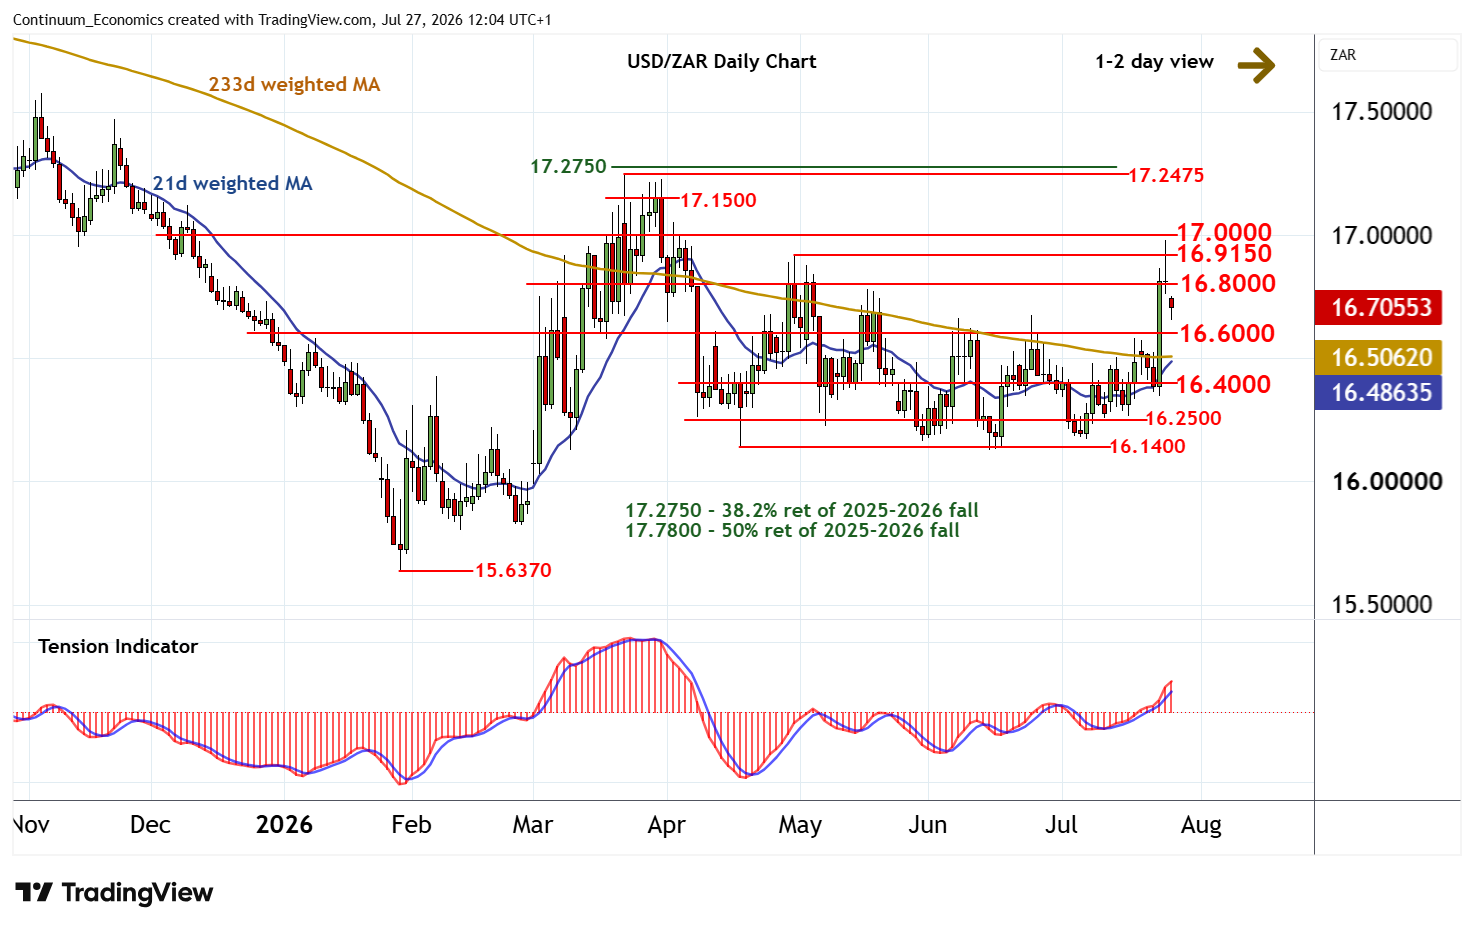
Cautious trade following the test above the 16.9150 weekly high of 30 April has given way to a deeper retracement
| Level | Comment | Level | Comment | |||||
|---|---|---|---|---|---|---|---|---|
| R4 | 17.0000 | * | congestion | S1 | 16.6000 | * | congestion | |
| R3 | 16.9785 | * | 24 Jul (w) high | S2 | 16.4000 | congestion | ||
| R2 | 16.9150 | ** | 30 Apr (w) high | S3 | 16.2500 | * | congestion | |
| R1 | 16.8000 | ** | congestion | S4 | 16.1400 | ** | 17 Apr (m) range low |
Asterisk denotes strength of level
11:45 BST - Cautious trade following the test above the 16.9150 weekly high of 30 April has given way to a deeper retracement, with prices currently trading around 16.7000. Intraday studies are under pressure, highlighting room for a test of congestion support at 16.6000. But rising daily readings and positive weekly charts should limit any break beneath here in renewed buying interest/consolidation above further congestion around 16.4000. Following cautious/corrective trade, fresh gains are looked for. Immediate resistance is at congestion around 16.8000. But a close above 16.9150 is needed to improve sentiment and extend mid-April gains towards congestion around 17.0000. However, already overbought daily stochastics should limit any immediate tests above here in profit-taking/consolidation beneath critical resistance at the 17.2475 current year high of 23 March and the 17.2750 Fibonacci retracement.