Chart USD Index DXY Update: Balanced beneath year high - daily studies under pressure
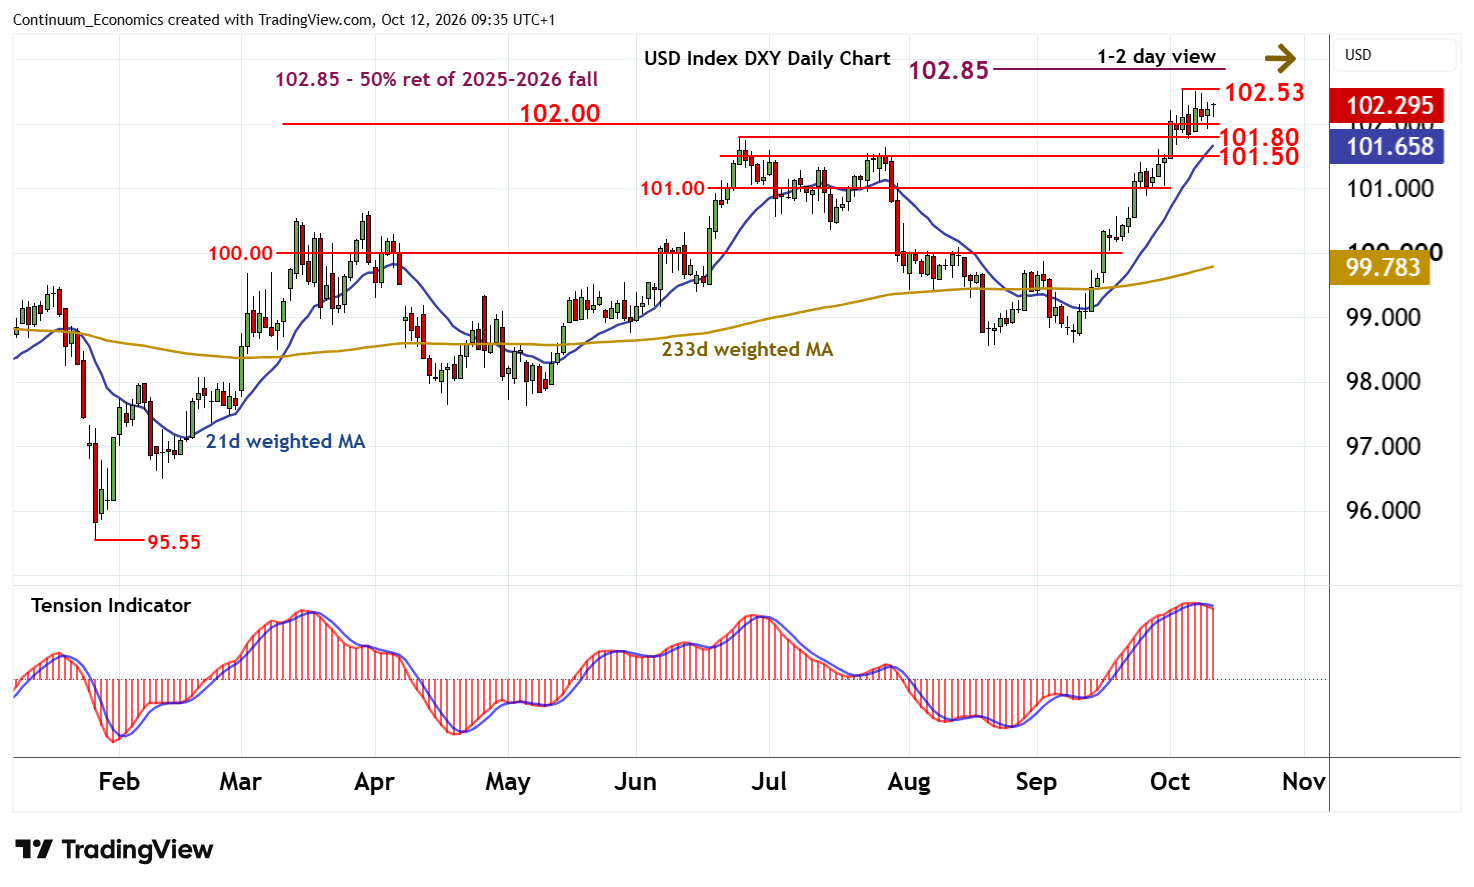
Little change, as mixed intraday studies keep near-term sentiment cautious and extend consolidation within the 102.00 - 102.53 range
| Levels | Imp | Comment | Levels | Imp | Comment | |||
|---|---|---|---|---|---|---|---|---|
| R4 | 103.50 | * | congestion | S1 | 102.00 | ** | congestion | |
| R3 | 103.00 | ** | congestion | S2 | 101.80 | * | 24 Jun (m) high | |
| R2 | 102.85 | ** | 50% ret of 2025-2026 fall | S3 | 101.50 | * | range highs | |
| R1 | 102.53 | ** | 5 Oct YTD high | S4 | 101.00 | ** | congestion |
Asterisk denotes strength of level
09:20 BST - Little change, as mixed intraday studies keep near-term sentiment cautious and extend consolidation within the 102.00 - 102.53 range. Daily stochastics and the daily Tension Indicator are falling, suggesting room for a test of support within the 101.80 monthly high of 24 June and congestion around 102.00. But rising weekly charts should limit any deeper losses in renewed buying interest/consolidation above the 101.50 range highs.
Following cautious/corrective trade, fresh gains are looked for. A break above the 102.53 current year high of 5 October will improve sentiment and extend broad January gains towards the 102.85 Fibonacci retracement.