Chart USD/JPY Update: Choppy beneath multi-year highs
Cautious trade has given way to a drift lower
| Levels | Imp | Comment | Levels | Imp | Comment | |||
|---|---|---|---|---|---|---|---|---|
| R4 | 163.95 | ** | December 1986 high | S1 | 161.50 | * | intraday break level | |
| R3 | 163.00 | * | historic congestion | S2 | 161.00 | * | intraday lows | |
| R2 | 162.85~ | ** | 1 July multi-year high | S3 | 160.72 | * | 30 Apr (m) high | |
| R1 | 162.50 | historic congestion | S4 | 160.00 | ** | congestion |
Asterisk denotes strength of level
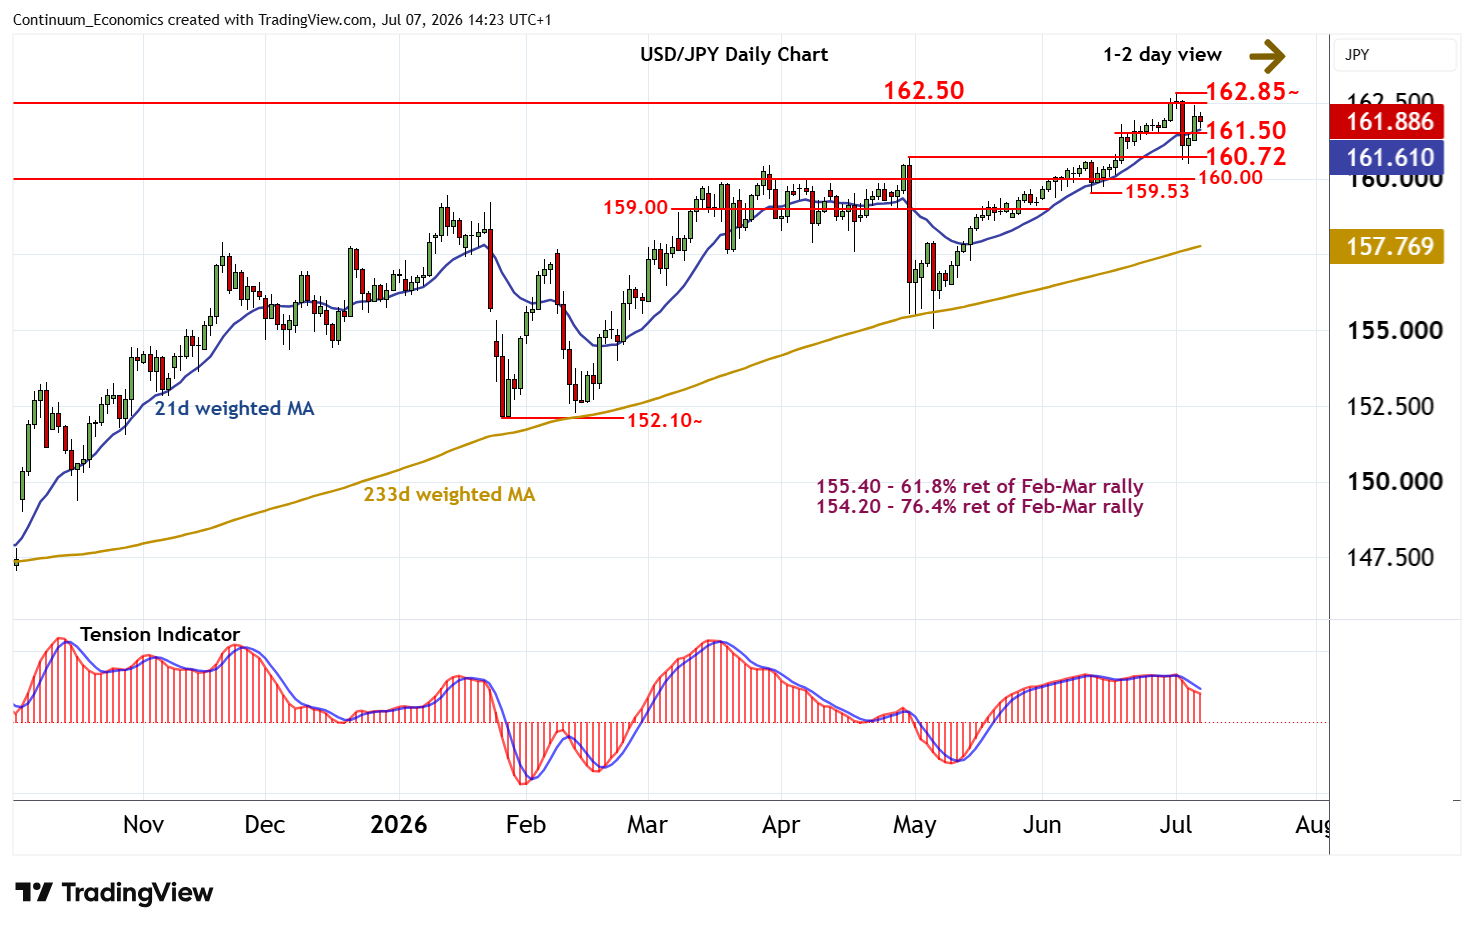
14:05 BST - Cautious trade has given way to a drift lower, as intraday studies turn down, with prices currently balanced around 161.85. Support remains at 161.50. But oversold daily stochastics are unwinding, suggesting any immediate tests could give way to fresh consolidation, before the bearish daily Tension Indicator prompt further losses. A break beneath here would open up support down to the 160.72 monthly high of 30 April. But rising weekly charts should limit any initial tests in consolidation. Meanwhile, resistance remains at congestion around 162.50 and extends to the 162.85~ multi-year high of 1 July. A close above here would turn sentiment positive and extend long-term gains beyond 163.00 towards the 163.95 high of December 1986.