Weekly Chart GBP/USD: Potential triangle/flag pattern to limit tests higher
Following recent global volatility, choppy trade within the broad 1.3300 - 1.3500 range is giving way to a fresh test higher
Following recent global volatility, choppy trade within the broad 1.3300 - 1.3500 range is giving way to a fresh test higher,
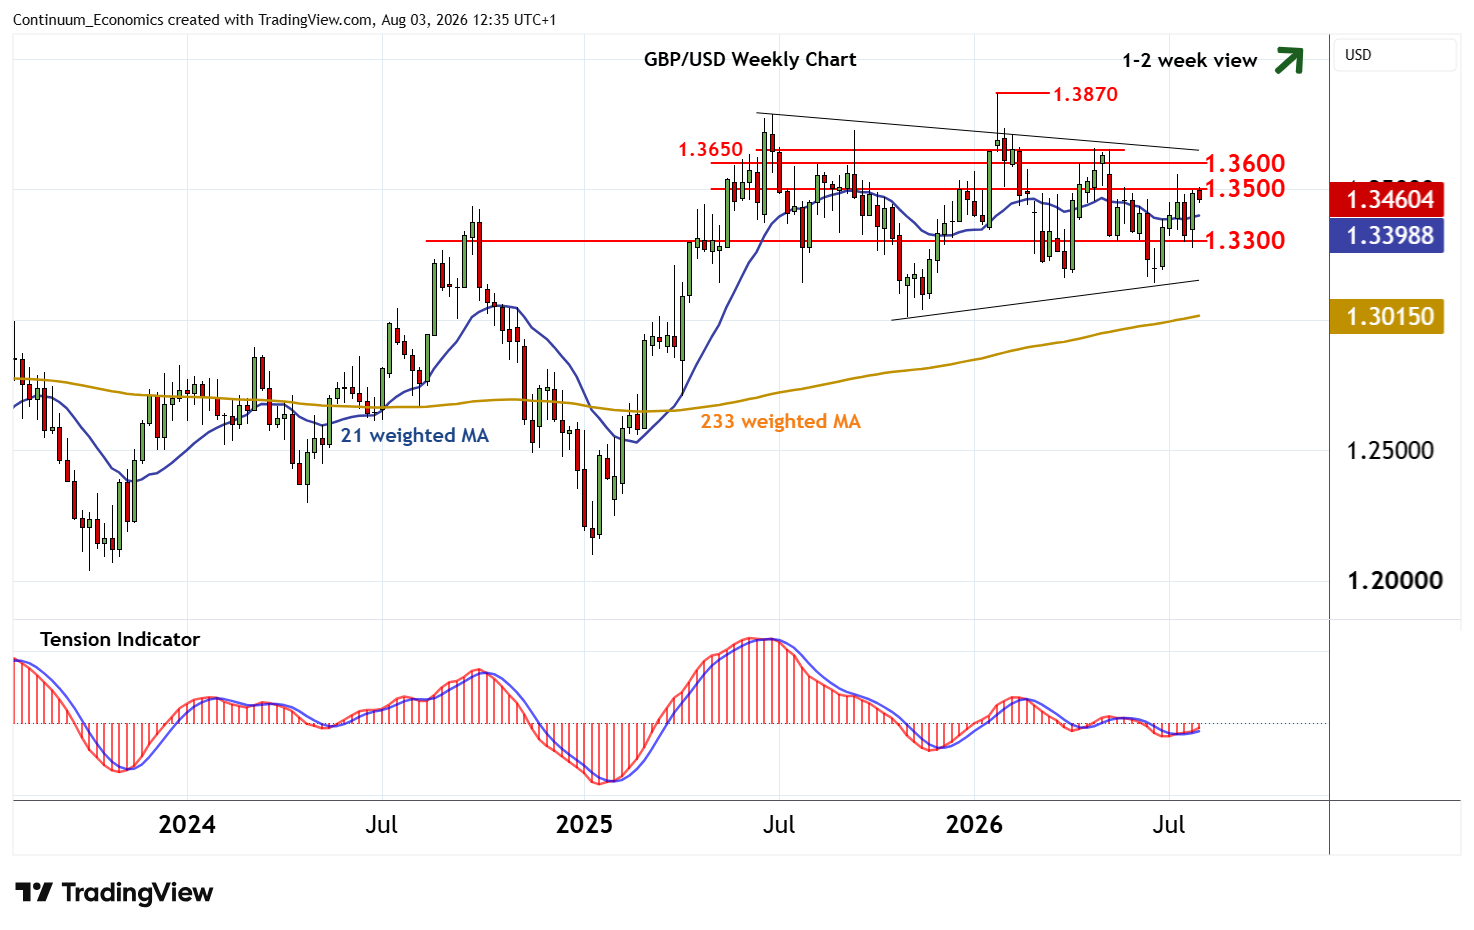
with prices currently pressuring congestion resistance at 1.3500.
The weekly Tension Indicator is rising, suggesting room for a break above here towards further congestion around 1.3600.
But rising weekly stochastics are flattening and prices are trading within a broader flag/triangle pattern, suggesting a cautious tone and risk of increased selling interest towards here.
A close above 1.3600 will open up congestion tops around 1.3650, with continuation beyond here improving sentiment and extending late-June gains towards critical resistance at the 1.3870 current year high of 27 January.
Meanwhile, support is at congestion around 1.3300 and extends to the 1.3273 weekly low of 28 July.
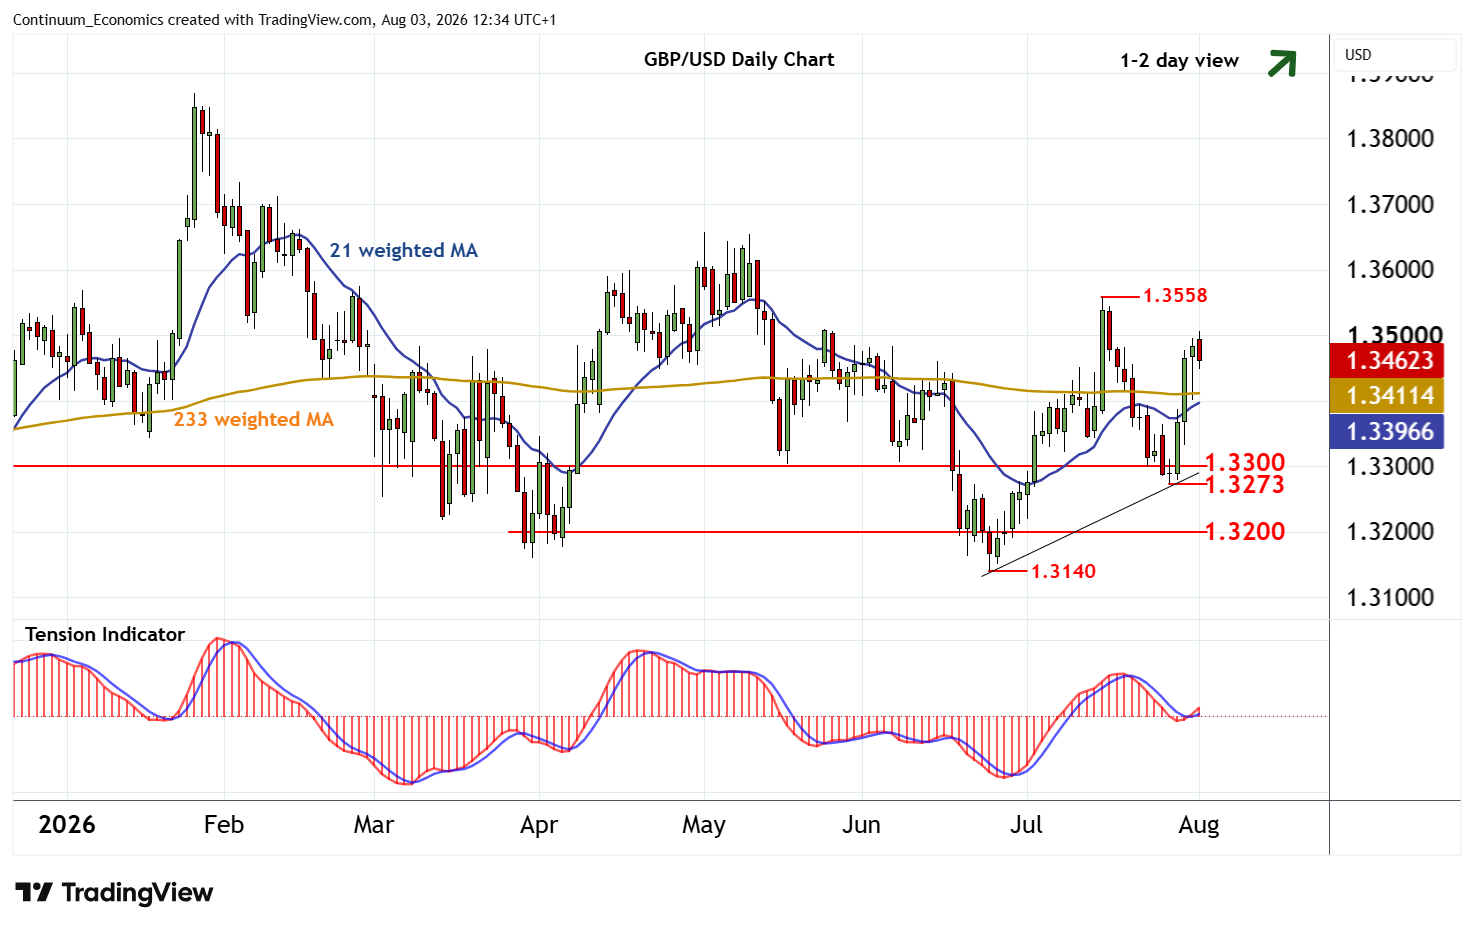
A close beneath here, if seen, would turn sentiment negative and extend losses from the 1.3558 monthly high of 15 July towards further congestion around 1.3200.
A further close below the 1.3140 current year low of 24 June would turn sentiment negative and extend January losses towards congestion around 1.3000.