Published: 2026-06-24T00:50:17.000Z
Chart NZD/USD Update: Extending losses
-
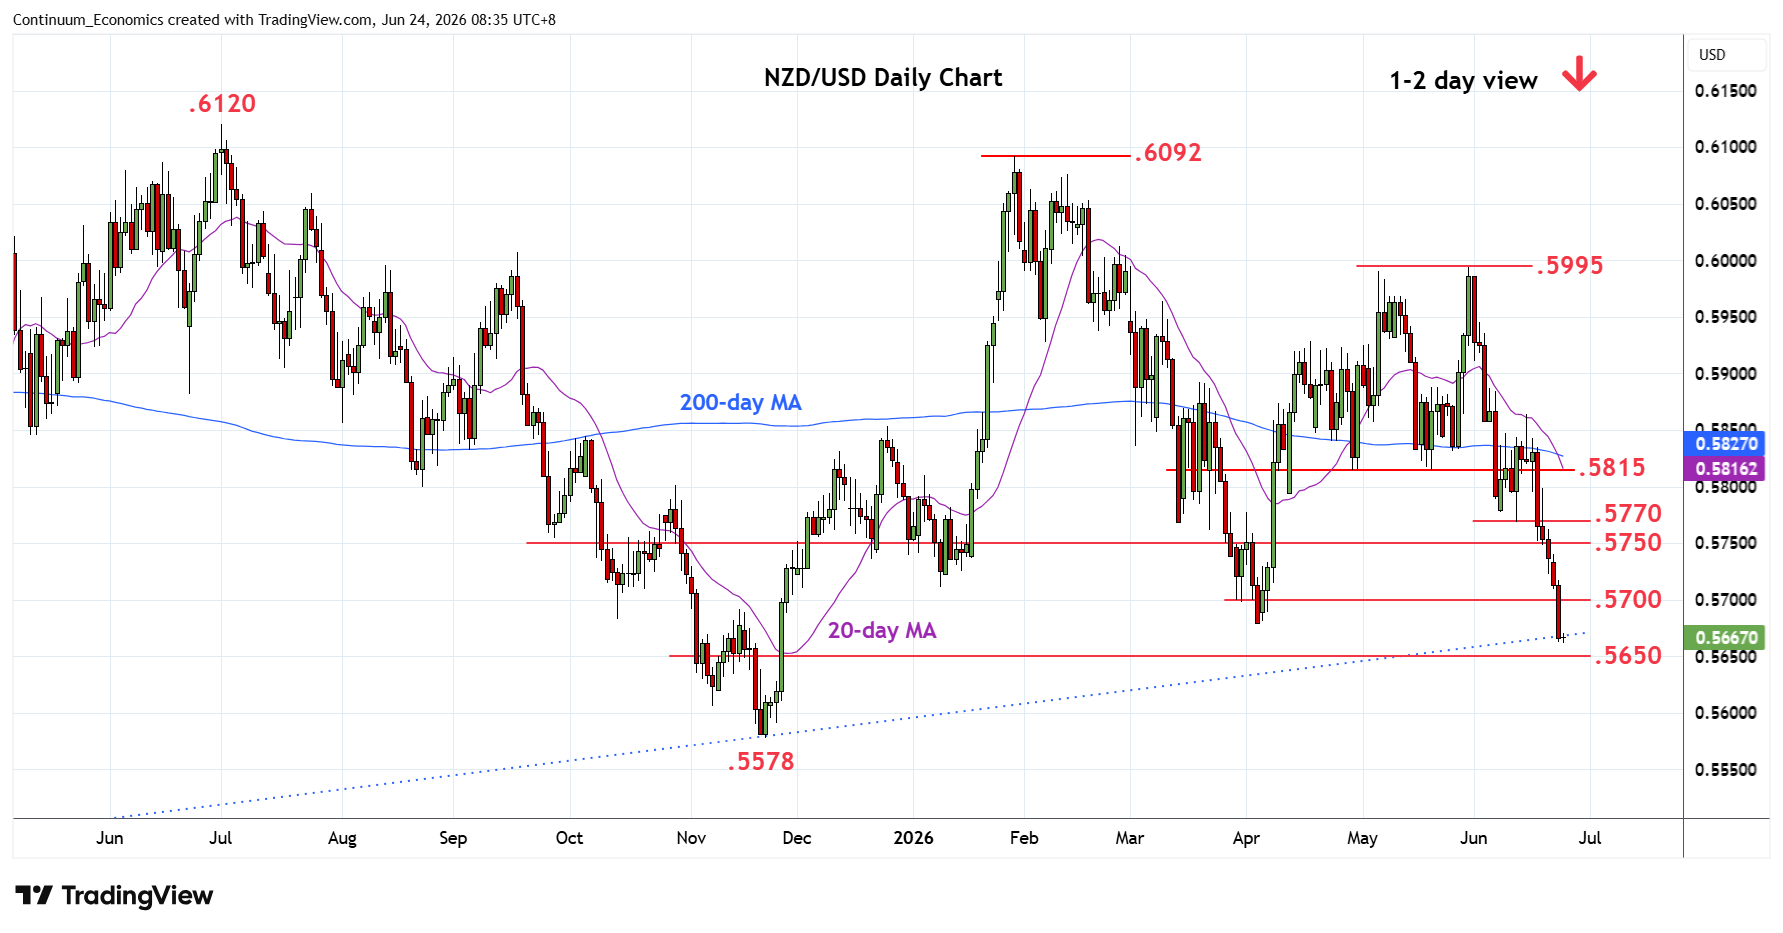
Sharply lower with losses reaching fresh year low to test trendline from the April 2025 low at .5665
| Levels | Imp | Comment | Levels | Imp | Comment | |||
|---|---|---|---|---|---|---|---|---|
| R4 | .5800/15 | ** | congestion, May low | S1 | .5665 | * | April 2025 trendline | |
| R3 | .5770 | * | 11 Jun low | S2 | .5650 | * | congestion | |
| R2 | .5750 | * | congestion | S3 | .5600 | * | congestion | |
| R1 | .5700 | * | congestion | S4 | .5578 | ** | Nov low |
Asterisk denotes strength of level
00:40 GMT - Sharply lower with losses reaching fresh year low to test trendline from the April 2025 low at .5665. Consolidation here see prices unwinding oversold intraday and daily studies but bearish momentum keep focus firmly on the downside. Lower will see room to .5650/.5600 congestion area then .5578 November low. Meanwhile, resistance is lowered to .5680/.5700 April low and congestion area. Would need to regain this to ease the downside pressure and see room for stronger bounce to .5750/70 resistance.