Chart USD/RUB Update: Consolidating - studies under pressure
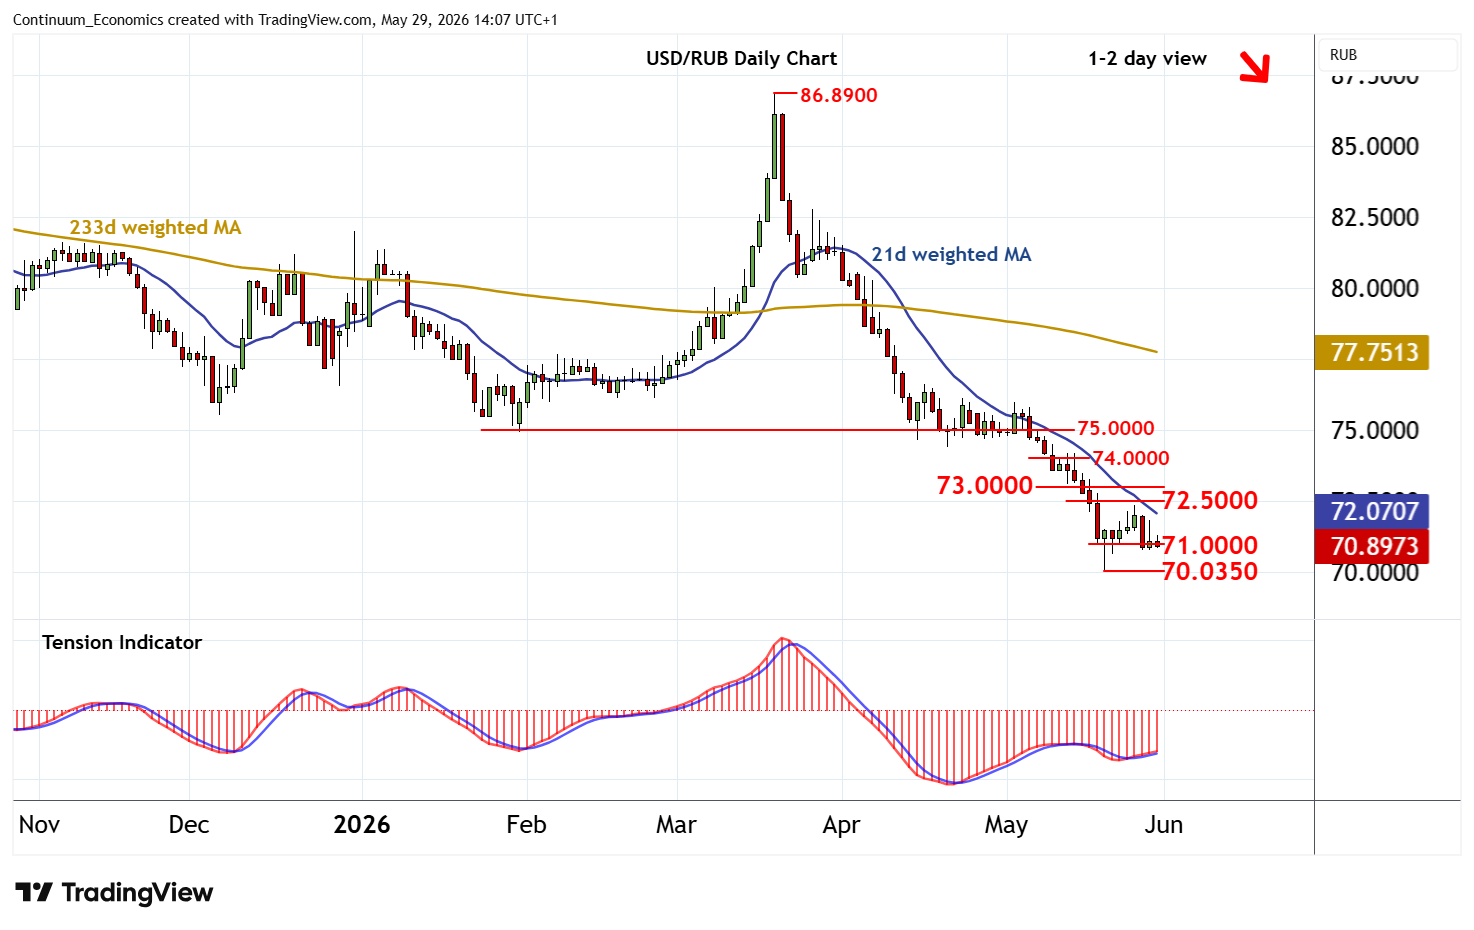
Little change, as prices extend cautious trade around congestion support at 71.0000
| Levels | Comment | Levels | Comment | |||||
| R4 | 75.0000 | ** | congestion | S1 | 71.0000 | * | congestion | |
| R3 | 74.0000 | * | congestion | S2 | 70.0350 | ** | 20 May YTD low | |
| R2 | 73.0000 | * | break level | S3 | 70.0000 | ** | historic congestion | |
| R1 | 72.5000 | * | break level | S4 | 69.0200 | * | February 2023 low |
Asterisk denotes strength of level
13:55 BST - Little change, as prices extend cautious trade around congestion support at 71.0000. Daily readings have turned mixed, suggesting potential for further consolidation in the coming sessions. However, broader weekly charts are bearish and longer-term charts are also under pressure, highlighting room for fresh losses in the coming sessions. A break beneath 71.0000 will open up critical support at the 70.0350 current year low of 20 May. A further close beneath here will turn sentiment negative and extend November 2024 losses below 70.0000 towards the 69.0200 low of February 2023. Meanwhile, resistance remains up to 72.5000 and should cap any immediate tests higher.