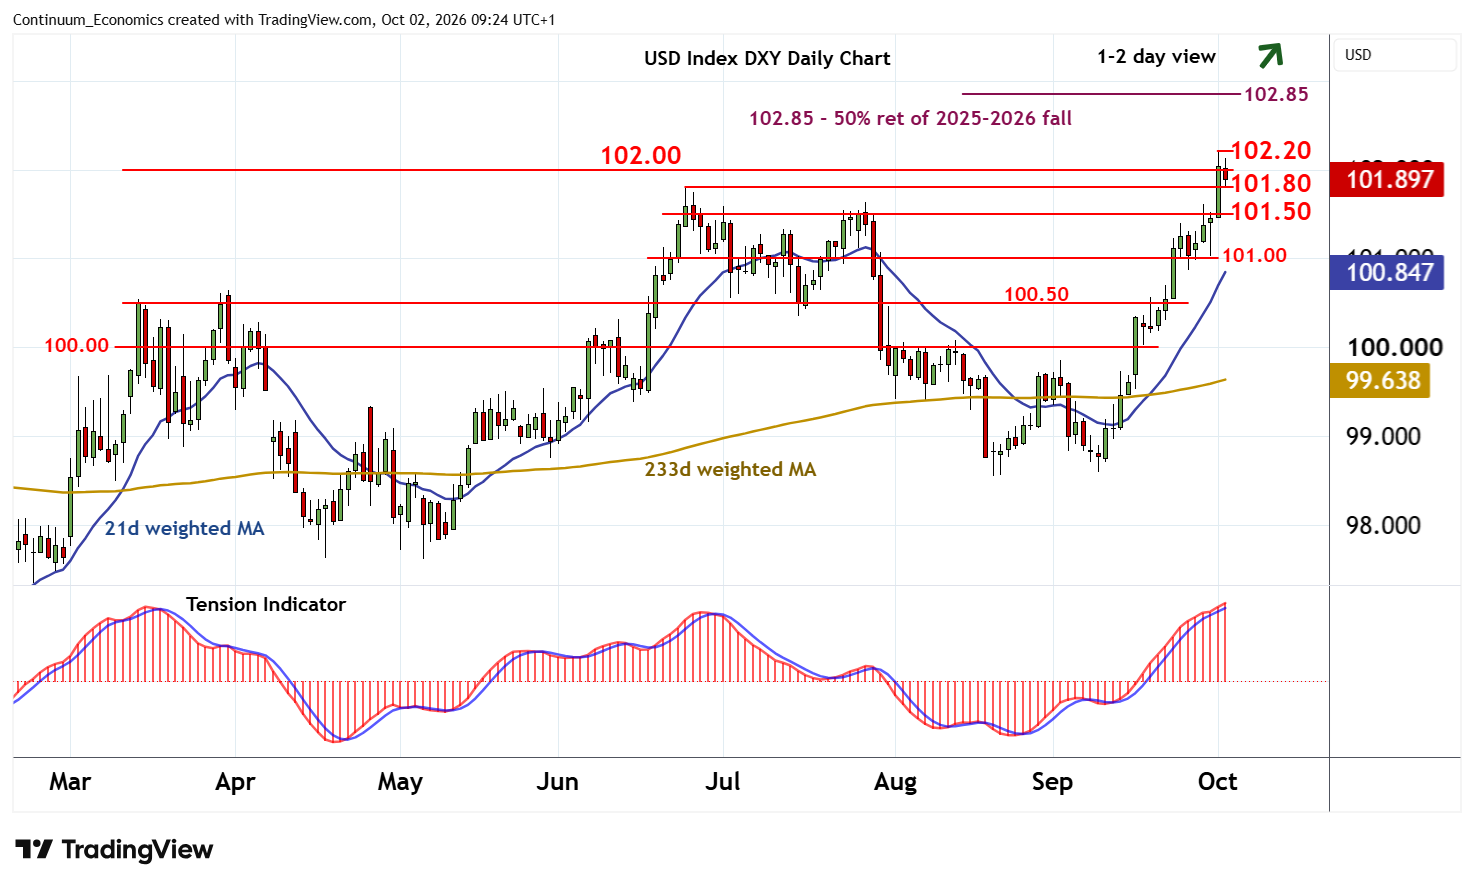
Chart USD Index DXY Update: Turning away from fresh year high
Anticipated gains have posted a fresh year high at 102.20
| Levels | Imp | Comment | Levels | Imp | Comment | |||
|---|---|---|---|---|---|---|---|---|
| R4 | 103.00 | ** | congestion | S1 | 101.80 | * | 24 Jun (m) high | |
| R3 | 102.85 | ** | 50% ret of 2025-2026 fall | S2 | 101.50 | * | range highs | |
| R2 | 102.20 | * | 1 Oct YTD high | S3 | 101.00 | ** | congestion | |
| R1 | 102.00 | ** | congestion | S4 | 100.50 | break level |
Asterisk denotes strength of level
09:15 BST - Anticipated gains have posted a fresh year high at 102.20, before settling back as intraday studies turn down, into consolidation within the tight 101.80 - 102.00 range. Overbought daily stochastics are also coming under pressure, suggesting room for a test below the 101.80 monthly high of 24 June. But the positive daily Tension Indicator and bullish weekly charts should limit scope in renewed buying interest/consolidation above the 101.50 range highs.
Following cautious/corrective trade, fresh gains are looked for. A break above congestion resistance at 102.00 and 102.20 will improve sentiment and extend broad January gains towards the 102.85 Fibonacci retracement.