Published: 2026-05-21T06:10:20.000Z
Chart NOK/SEK Update: Leaning lower from 1.0230 YTD high
4
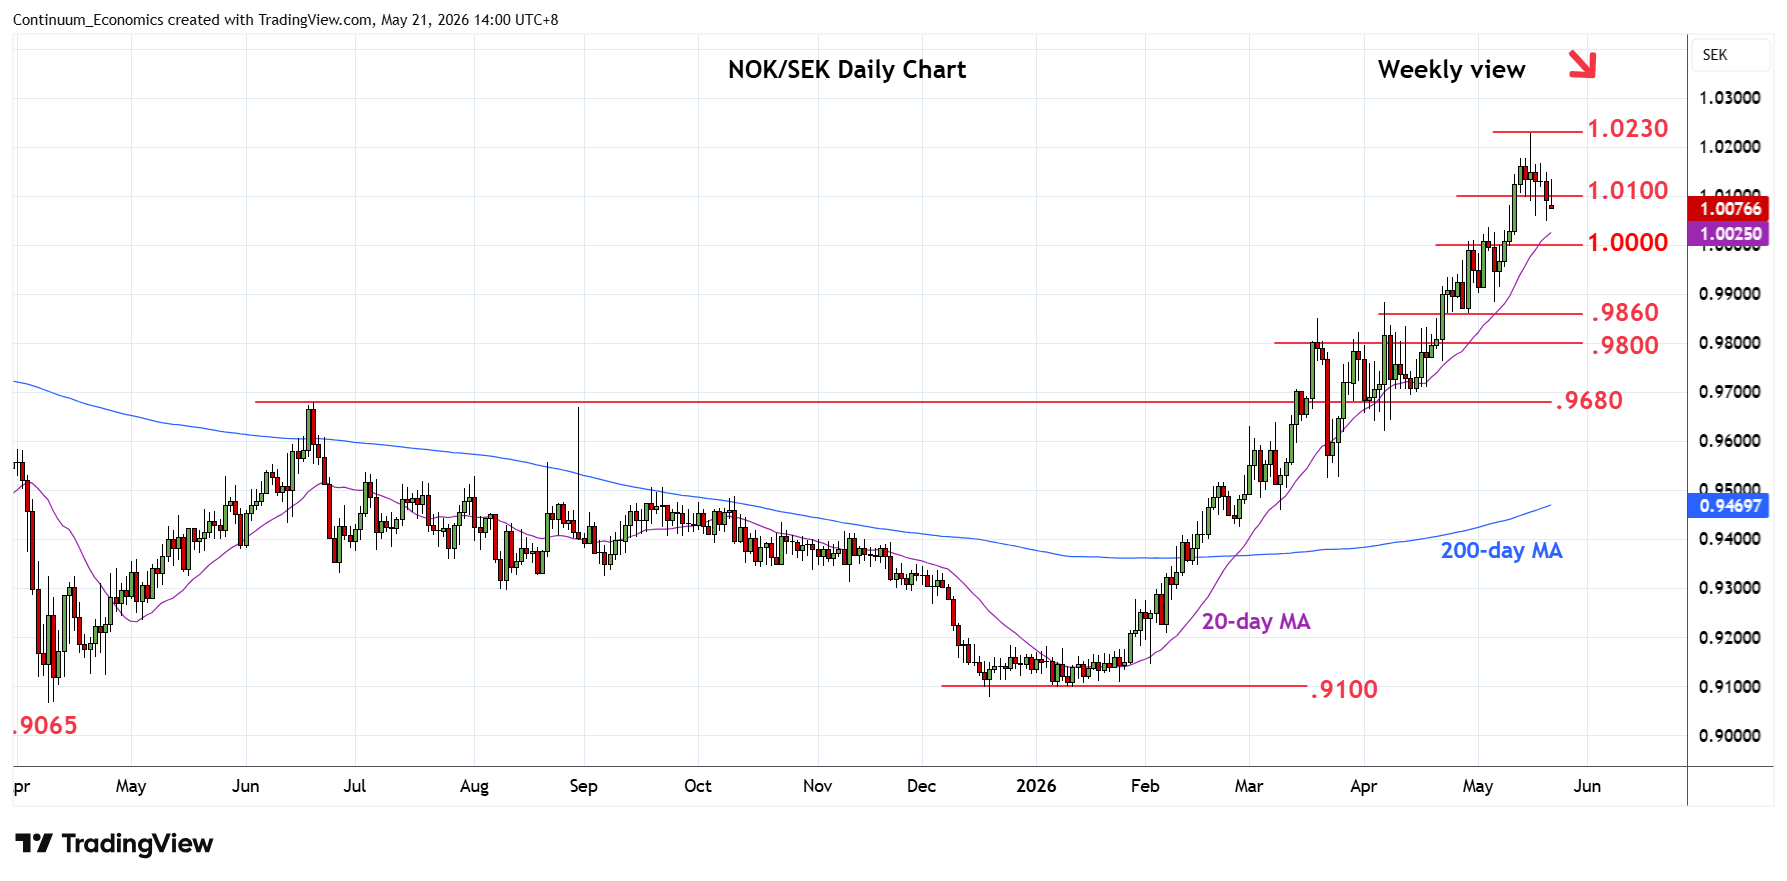
Leaning lower from the 15 May current year high at 1.0230 as prices unwind overbought daily and weekly studies
| Levels | Imp | Comment | Levels | Imp | Comment | |||
|---|---|---|---|---|---|---|---|---|
| R4 | 1.0350 | * | 61.8% 2022/2025 fall | S1 | 1.0050 | congestion | ||
| R3 | 1.0300 | * | congestion | S2 | 1.0000 | ** | parity | |
| R2 | 1.0230 | ** | 15 May YTD high | S3 | .9900 | * | congestion | |
| R1 | 1.0200/20 | * | congestion, Aug 2023 low | S4 | .9860/00 | * | 29 Apr low, 38.2% |
Asterisk denotes strength of level
06:00 GMT - Leaning lower from the 15 May current year high at 1.0230 as prices unwind overbought daily and weekly studies. Lower will see room to support at the parity level. Break here will fade the upside pressure and see room for deeper pullback to retrace strong gains from the .9100 January current year low. Lower will see room to the .9900 congestion then the .9860/.9800 area and 38.2% Fibonacci retracement. Meanwhile, resistance at the 1.0200/20 congestion and the 1.0230 high are expected to cap.