Published: 2026-06-10T00:45:15.000Z
Chart USD/JPY Update: Edging towards 160.46/160.72, March/April highs
1
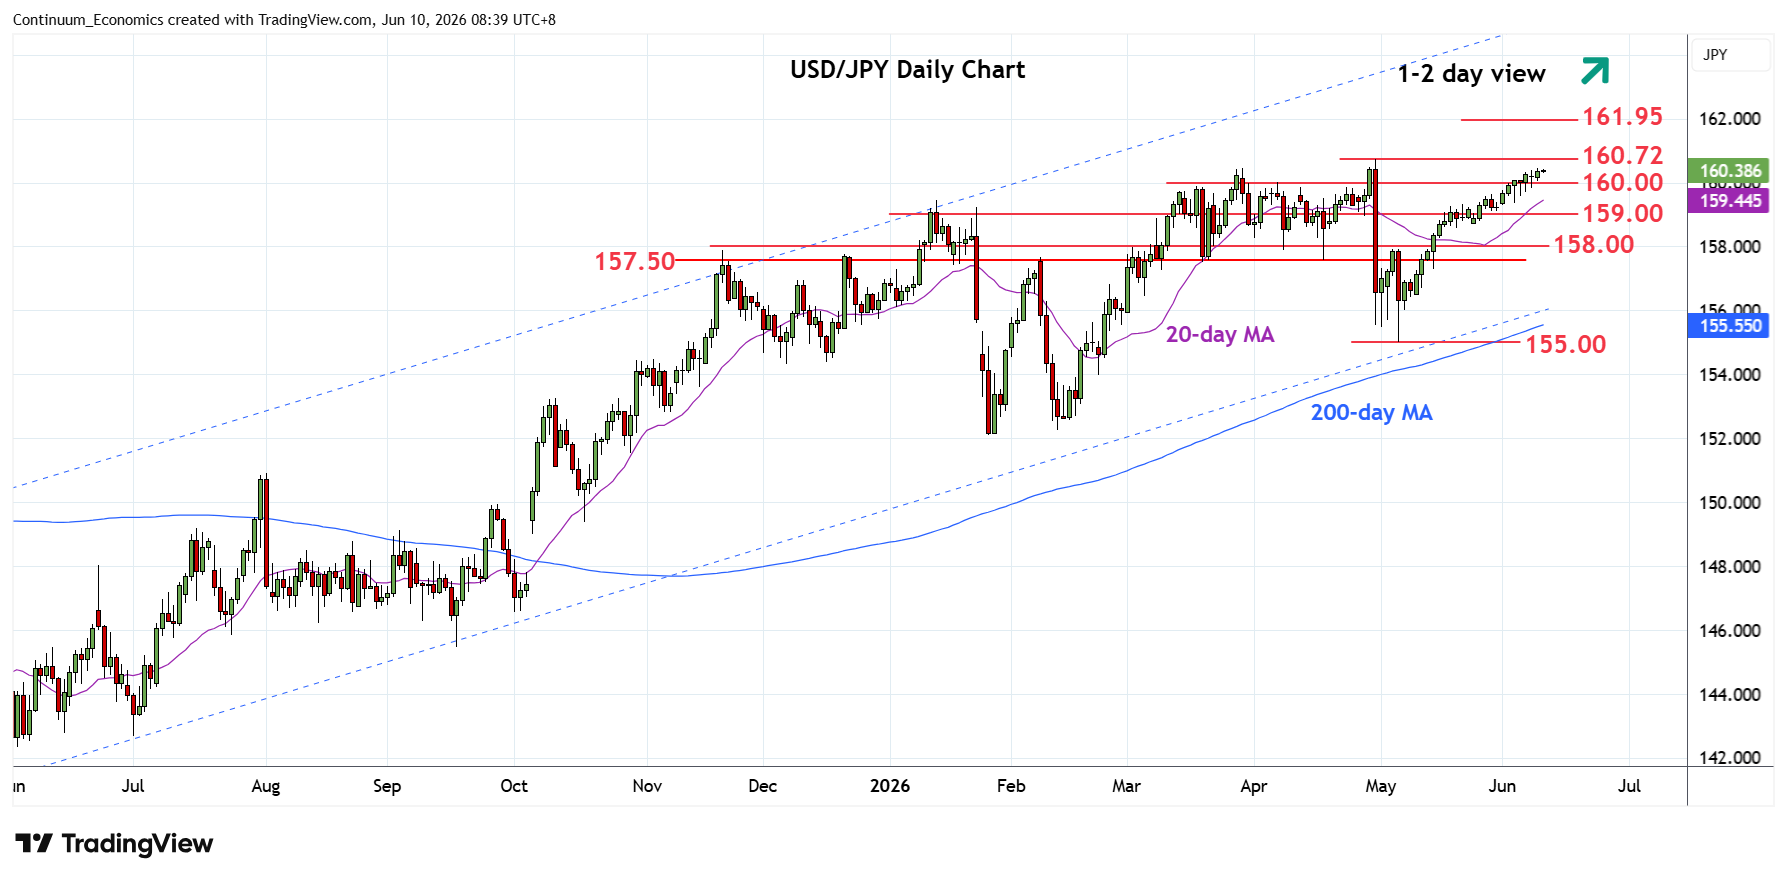
Edging higher as prices extend choppy gains above the 160.00 figure to approach the 160.46 resistance
| Levels | Imp | Comment | Levels | Imp | Comment | |||
|---|---|---|---|---|---|---|---|---|
| R4 | 161.95 | ** | Jul 2024 multi-yr high | S1 | 159.00 | * | congestion | |
| R3 | 161.00 | * | figure | S2 | 158.60 | * | 18 May low | |
| R2 | 160.72 | ** | 30 Apr YTD high | S3 | 158.00 | * | congestion | |
| R1 | 160.46 | * | Mar high | S4 | 157.50 | ** | congestion |
Asterisk denotes strength of level
00:40 GMT - Edging higher as prices extend choppy gains above the 160.00 figure to approach the 160.46 resistance. Gains from the 155.00 May low keep pressure on the upside and higher will see scope to retest the 160.72 April current year high. However, would expect these to cap and give way to fresh selling pressure later. Break, if seen, will turn focus to the 161.95, July 2024 year high. Meanwhile, support remains at the 159.35/159.00 congestion. Would take break here and the 158.60 low of 18 May to fade the upside pressure and open up room for deeper pullback to retrace gains from 155.00 low.