Chartbook: US Chart 10 Year Yield: Retracement in the coming weeks - background studies improving
The anticipated break higher in yields has posted a fresh 2026 year high at 4.687%
The anticipated break higher in yields has posted a fresh 2026 year high at 4.687%,
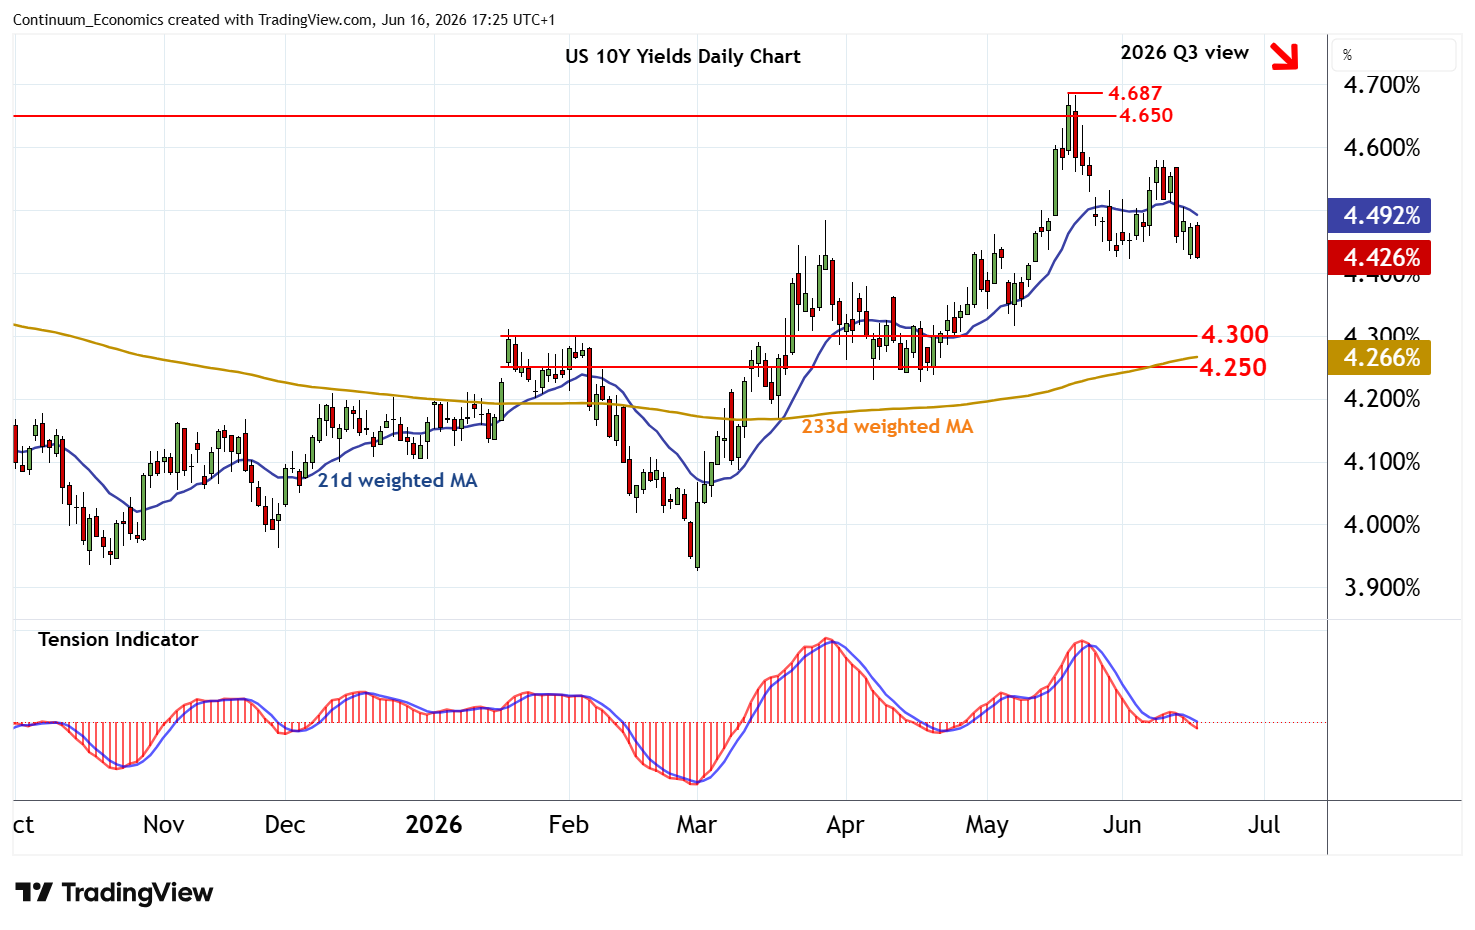
where fresh selling pressure has prompted a choppy retracement back into the 3-year triangle pattern.
Immediate focus is on congestion support around 4.400%.
But a further break towards congestion support within the 4.250% - 4.300% range is looked for, as falling weekly stochastics unwind overbought areas and the weekly Tension Indicator turns bearish.
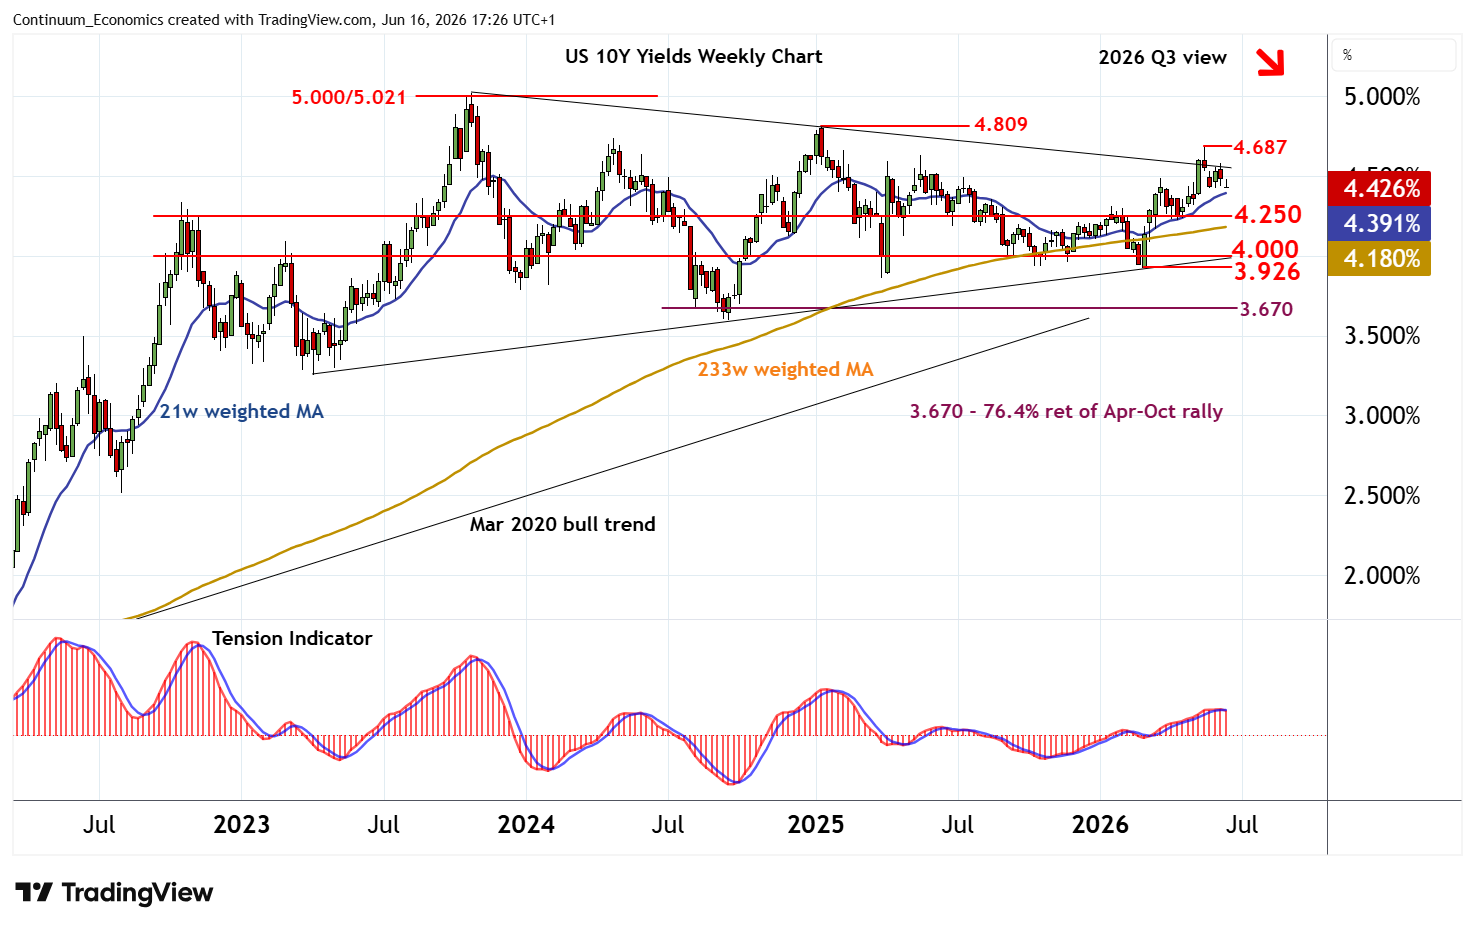
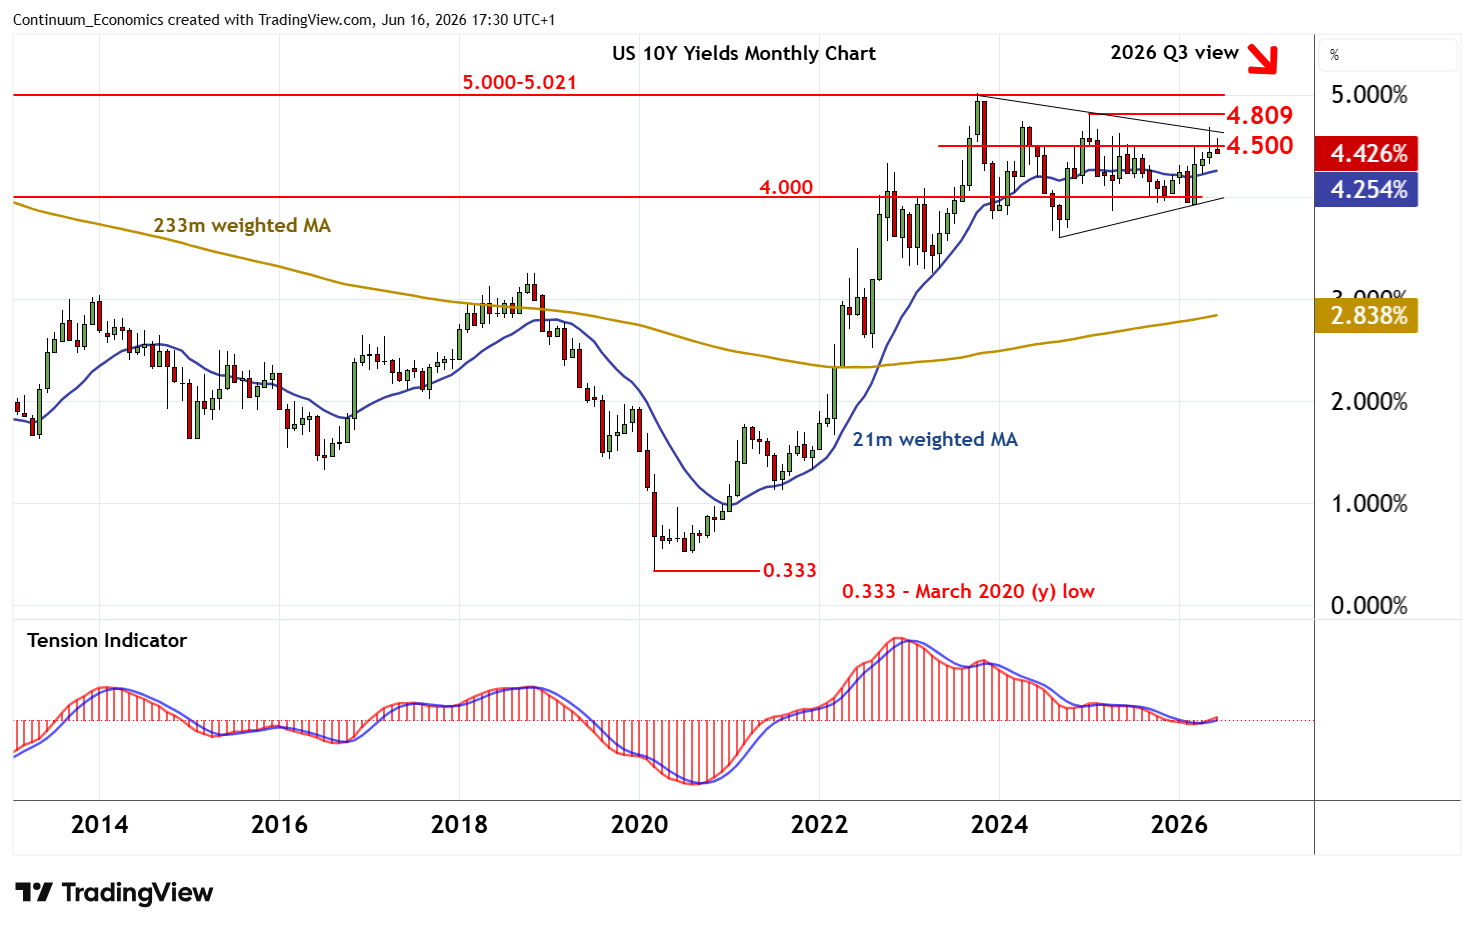
Continuation beneath here cannot be ruled out, with focus then turning to critical support at congestion around 4.000% and the 3.926% current year low of March.
But rising monthly charts should limit any pullback towards here in renewed buying interest.
Meanwhile, resistance is at congestion around 4.500% and extends to 4.687%.
A close above here, if seen, would improve price action and put focus on the 4.809 year high of January 2025.
However, a close above the 5.021% multi-year high of October 2023 is needed to confirm a period of multi-month rising yields, as gains from the March 2020 low at 0.333% resume.