Published: 2026-10-28T00:26:54.000Z
Chart AUD/USD Update: Edging higher in consolidation
1
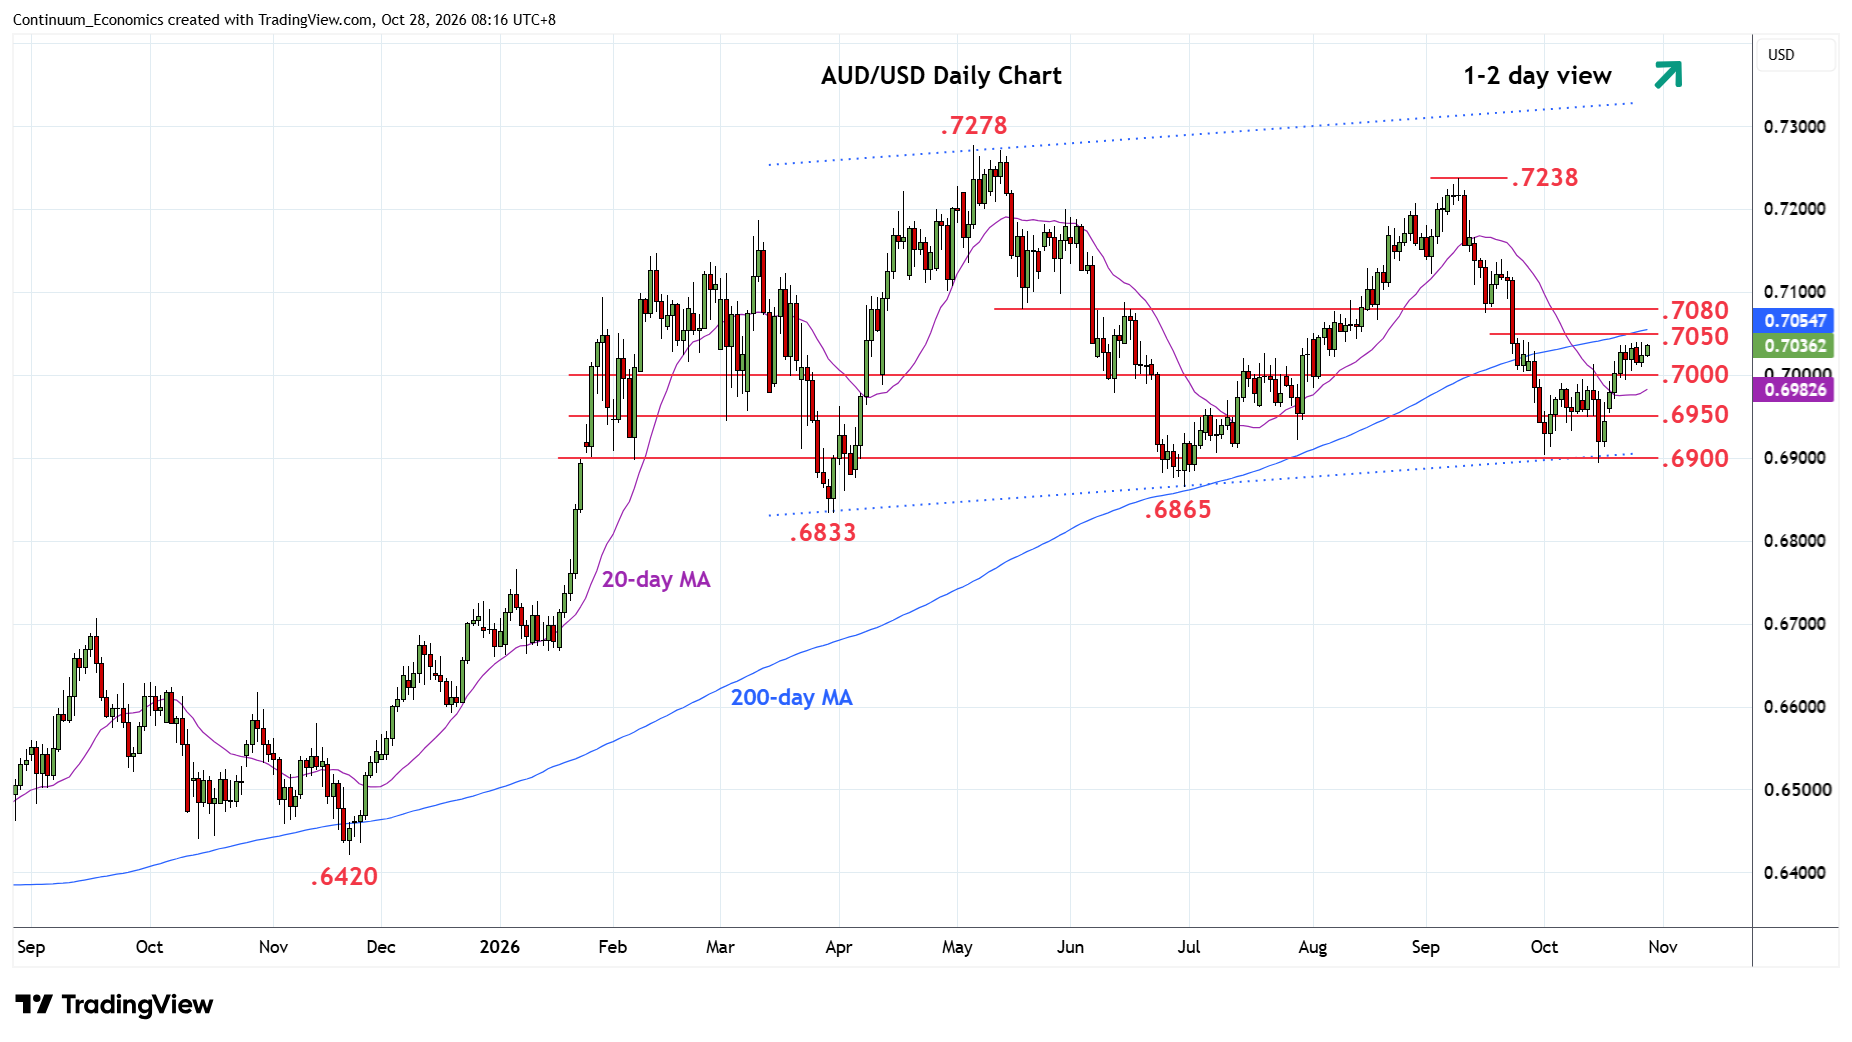
Firmer in consolidation above the .7000 level to retest the .7040 high
| Levels | Imp | Comment | Levels | Imp | Comment | |||
|---|---|---|---|---|---|---|---|---|
| R4 | 0.7140 | * | 21 Sep high | S1 | 0.7000 | * | congestion | |
| R3 | 0.7100/05 | * | congestion, 61.8% | S2 | 0.6950 | * | congestion | |
| R2 | 0.7080 | ** | May low, congestion | S3 | 0.6900 | ** | congestion, channel | |
| R1 | 0.7050/65 | * | congestion, 50% Sep/Oct fall | S4 | 0.6865 | ** | Jun low |
Asterisk denotes strength of level
00:20 GMT - Firmer in consolidation above the .7000 level to retest the .7040 high. The resulting ascending triangle support scope for break here to extend bullish gains from the .6900 low. Nearby see resistance at the .7050/65 congestion and Fibonacci level. Clearance here will see room for extension to strong resistance at .7080/.7100 area where reaction can be expected. Meanwhile, support remains at the .7000 level. Failure here will ease the upside pressure and leave the way open for deeper pullback to the .6950 congestion