Chart USD Index DXY Update: Edging higher
Cautious trade has given way to a push higher to congestion resistance at 100.00
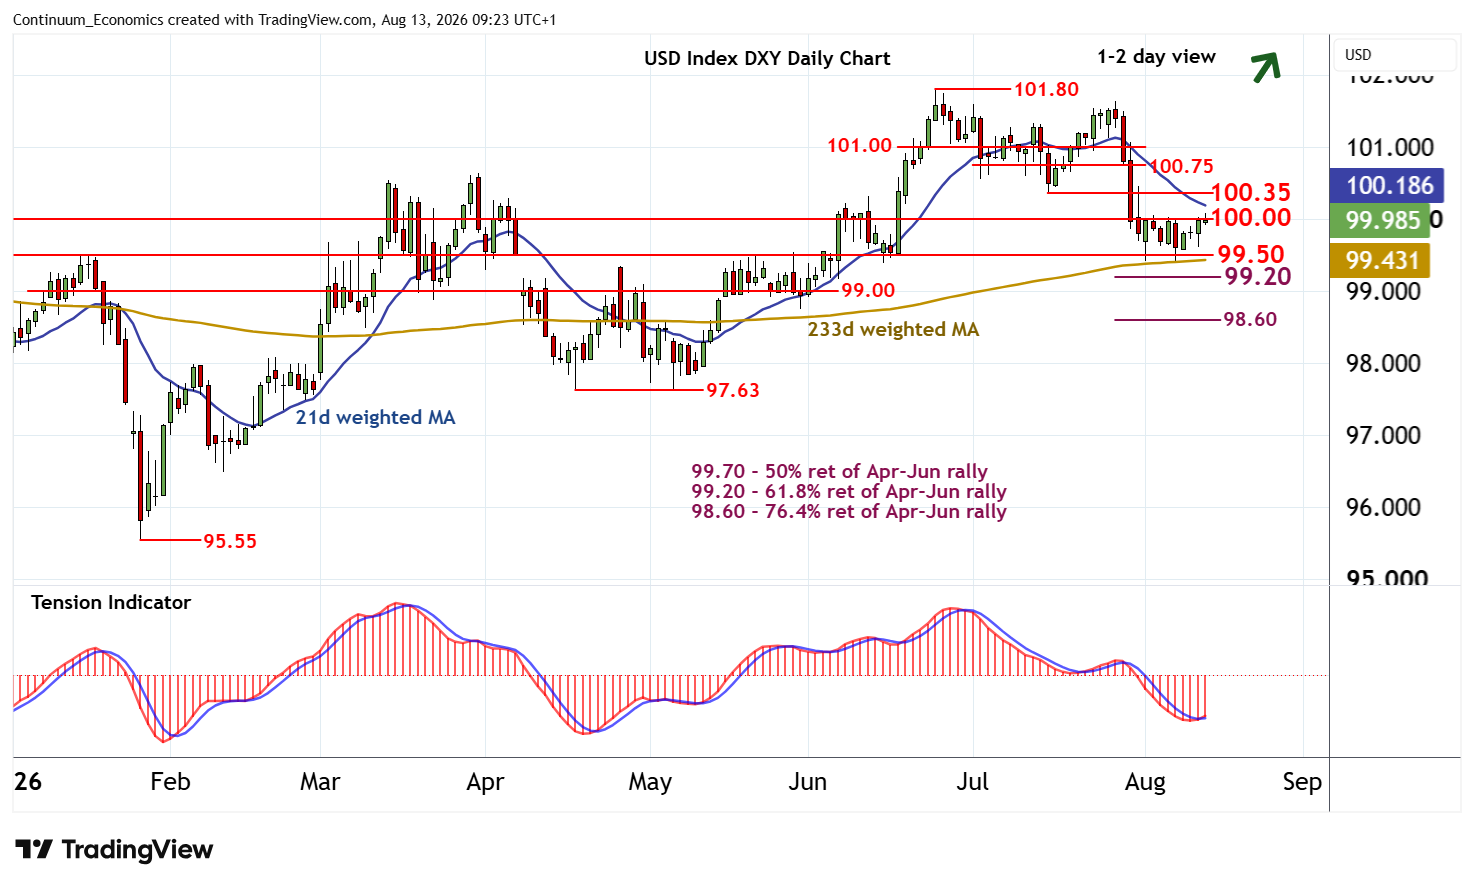
| Levels | Imp | Comment | Levels | Imp | Comment | |||
|---|---|---|---|---|---|---|---|---|
| R4 | 101.00 | ** | congestion base | S1 | 99.50 | ** | congestion | |
| R3 | 100.75 | congestion | S2 | 99.20 | ** | 61.8% ret of Apr-Jun rally | ||
| R2 | 100.35 | ** | 15 Jul (w) low | S3 | 99.00 | ** | congestion | |
| R1 | 100.00 | ** | congestion | S4 | 98.60 | ** | 76.4% ret of Apr-Jun rally |
Asterisk denotes strength of level
09:05 BST - Cautious trade has given way to a push higher to congestion resistance at 100.00, where flat overbought intraday studies are prompting fresh consolidation. Daily stochastics and the daily Tension Indicator continue to rise, highlighting room for a test above here. But negative weekly charts should limit scope in renewed selling interest/consolidation beneath the 100.35 weekly low of 15 July.
Following cautious/corrective trade, fresh losses are looked for. Support remains at congestion around 99.50. A later break will add weight to sentiment and extend late-June losses towards the 99.20 Fibonacci retracement. A further close beneath here will open up the 98.60 retracement.