Published: 2026-11-17T01:13:45.000Z
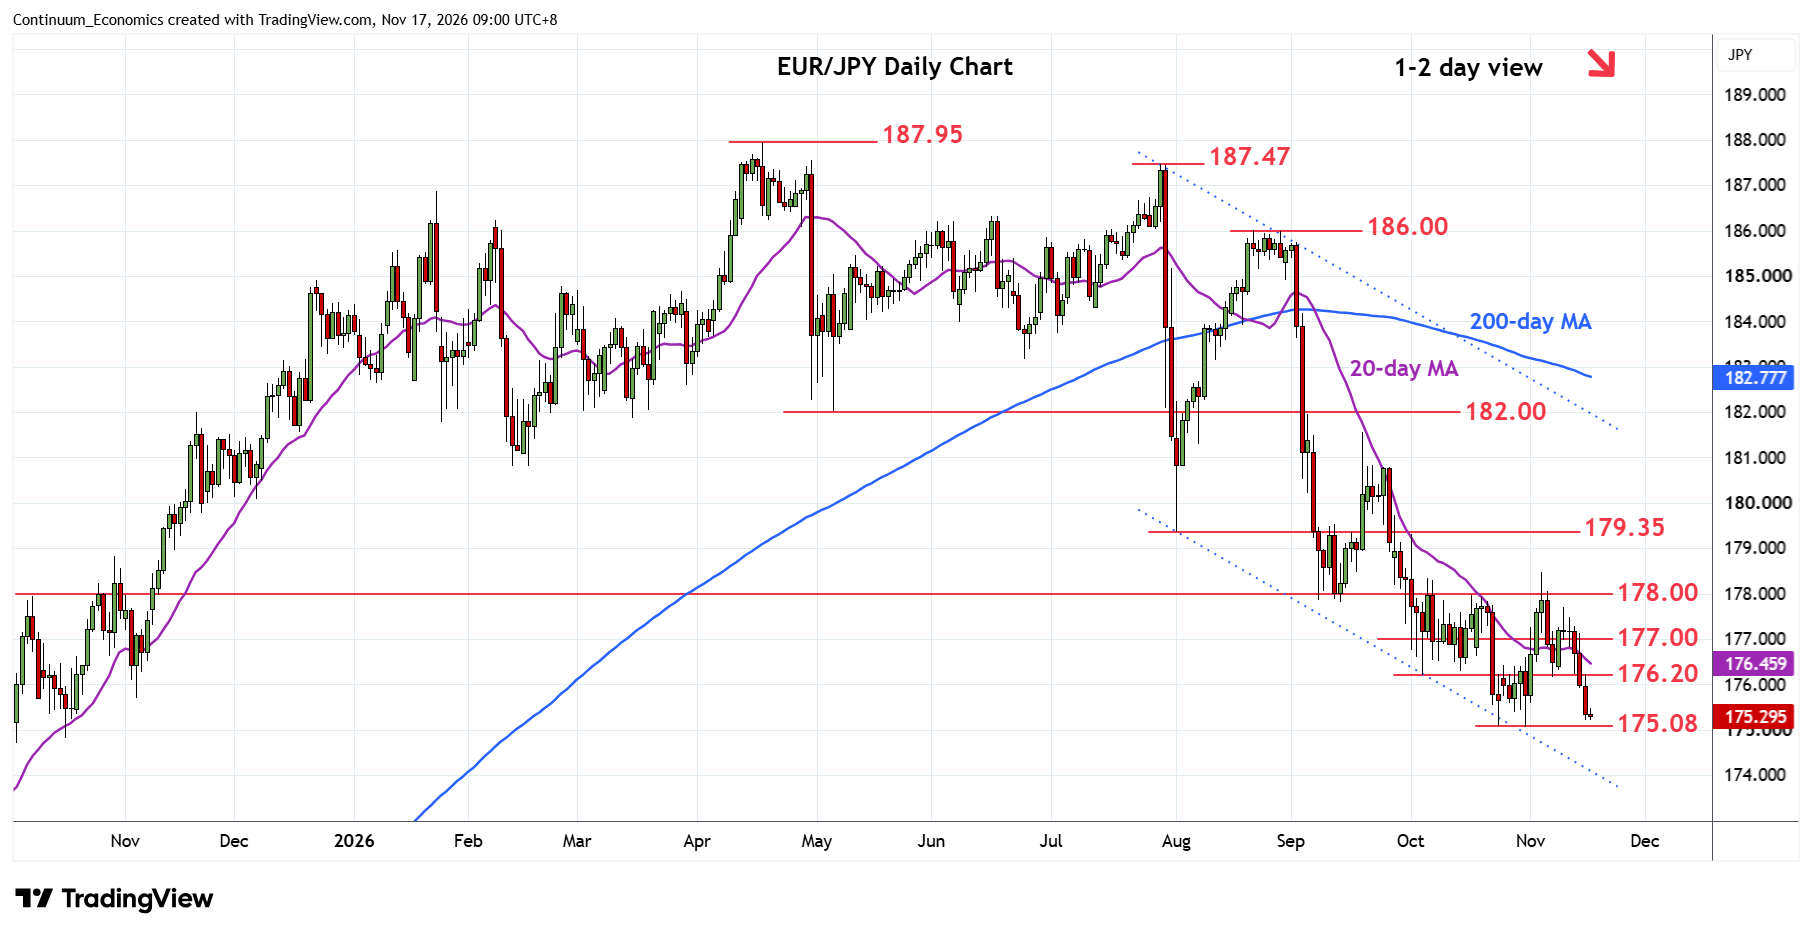
Chart EUR/JPY Update: Consolidating above 175.08, October YTD low
1
Break of the 176.20 support see prices within reach of the 175.08, October current year high
| Levels | Imp | Comment | Levels | Imp | Comment | |||
|---|---|---|---|---|---|---|---|---|
| R4 | 179.35 | ** | Aug low | S1 | 175.08 | ** | 30 Oct YTD low | |
| R3 | 178.00/50 | ** | congestion, 4 Nov high | S2 | 174.00 | * | congestion | |
| R2 | 177.00 | congestion | S3 | 173.90 | ** | Jul 2025 high | ||
| R1 | 176.20 | * | Oct low | S4 | 173.00 | * | congestion |
Asterisk denotes strength of level
01:10 GMT - Break of the 176.20 support see prices within reach of the 175.08, October current year high. Negative daily and weekly studies and stretched and suggest scope for bounce here to consolidate recent losses from the 178.50, 4 November swing high. Failure to hold this will see room for further losses to retrace the 2025/2026 rally to the 174.00/173.90 support. Meanwhile, resistance is lowered to 176.20 October low which is expected to cap and sustain losses from the 178.00/50 resistance and 4 November swing high.