Published: 2026-09-17T13:18:36.000Z
Chart USD/JPY Update: Consolidating recent gains
1
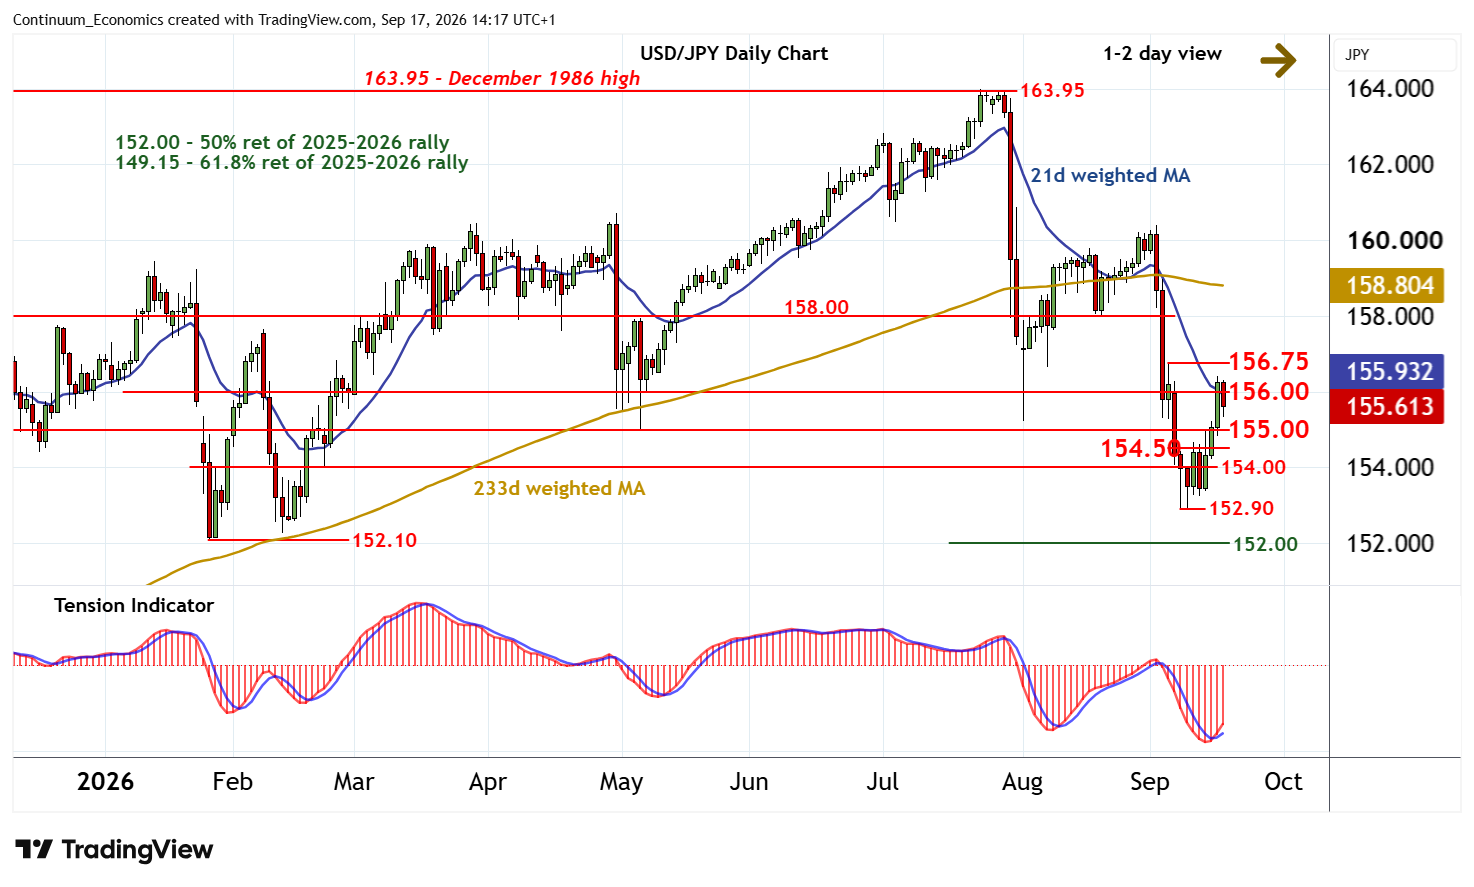
Anticipated tests higher have extended above congestion resistance at 156.00
| Levels | Imp | Comment | Levels | Imp | Comment | |||
|---|---|---|---|---|---|---|---|---|
| R4 | 158.00 | ** | congestion | S1 | 155.00 | * | congestion | |
| R3 | 156.75 | * | 4 Sep high | S2 | 154.50 | minor congestion | ||
| R2 | 156.40 | 16 Sep high | S3 | 154.00 | * | congestion | ||
| R1 | 156.00 | * | congestion | S4 | 152.90 | * | 8 Sep (w) low |
Asterisk denotes strength of level
14:00 BST - Anticipated tests higher have extended above congestion resistance at 156.00, with prices reaching 156.40 before settling back below 156.00. Negative intraday studies highlight room for continuation down to congestion support at 155.00. But rising daily stochastics and the positive daily Tension Indicator should limit any immediate tests in consolidation. Broader weekly charts are bearish, however, pointing to a later break towards 154.00, via 154.50.
Meanwhile, a close above 156.00 will help to stabilise price action and give way to consolidation beneath the 156.75 high of 4 September.