Weekly Chart USD Index DXY: Balanced at fresh year highs - background studies remain positive
Cautious trade has given way to renewed gains, with prices breaking above congestion resistance at 102.50 to post fresh year highs at congestion resistance around 104.00
Cautious trade has given way to renewed gains, with prices breaking above congestion resistance at 102.50 to post fresh year highs at congestion resistance around 104.00.
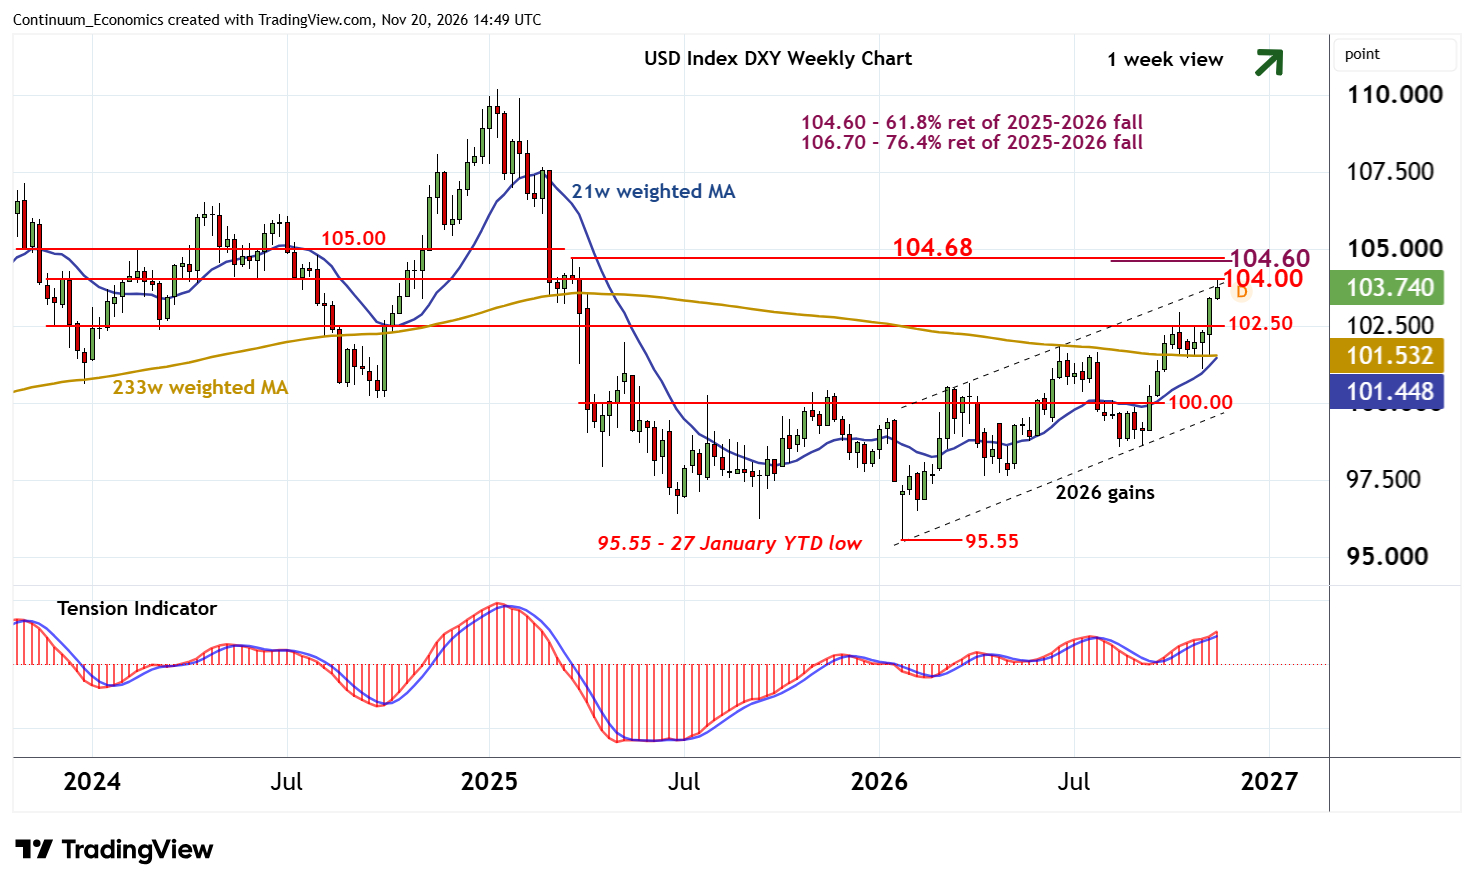
Weekly stochastics and the weekly Tension Indicator continue to rise, suggesting room for a later break above here and continuation of broad 2026 gains towards strong resistance at the 104.60 Fibonacci retracement and the 104.68 weekly high of 26 March 2025. Already overbought weekly stochastics point to increased risk of profit-taking/consolidation towards here, before rising longer-term charts extend gains still further. A close above here will improve already positive sentiment and extend gains from the 95.55 current year low of 27 January beyond 105.00.
Meanwhile, support is down to the 102.95 monthly high of 14 October and congestion around 103.00.
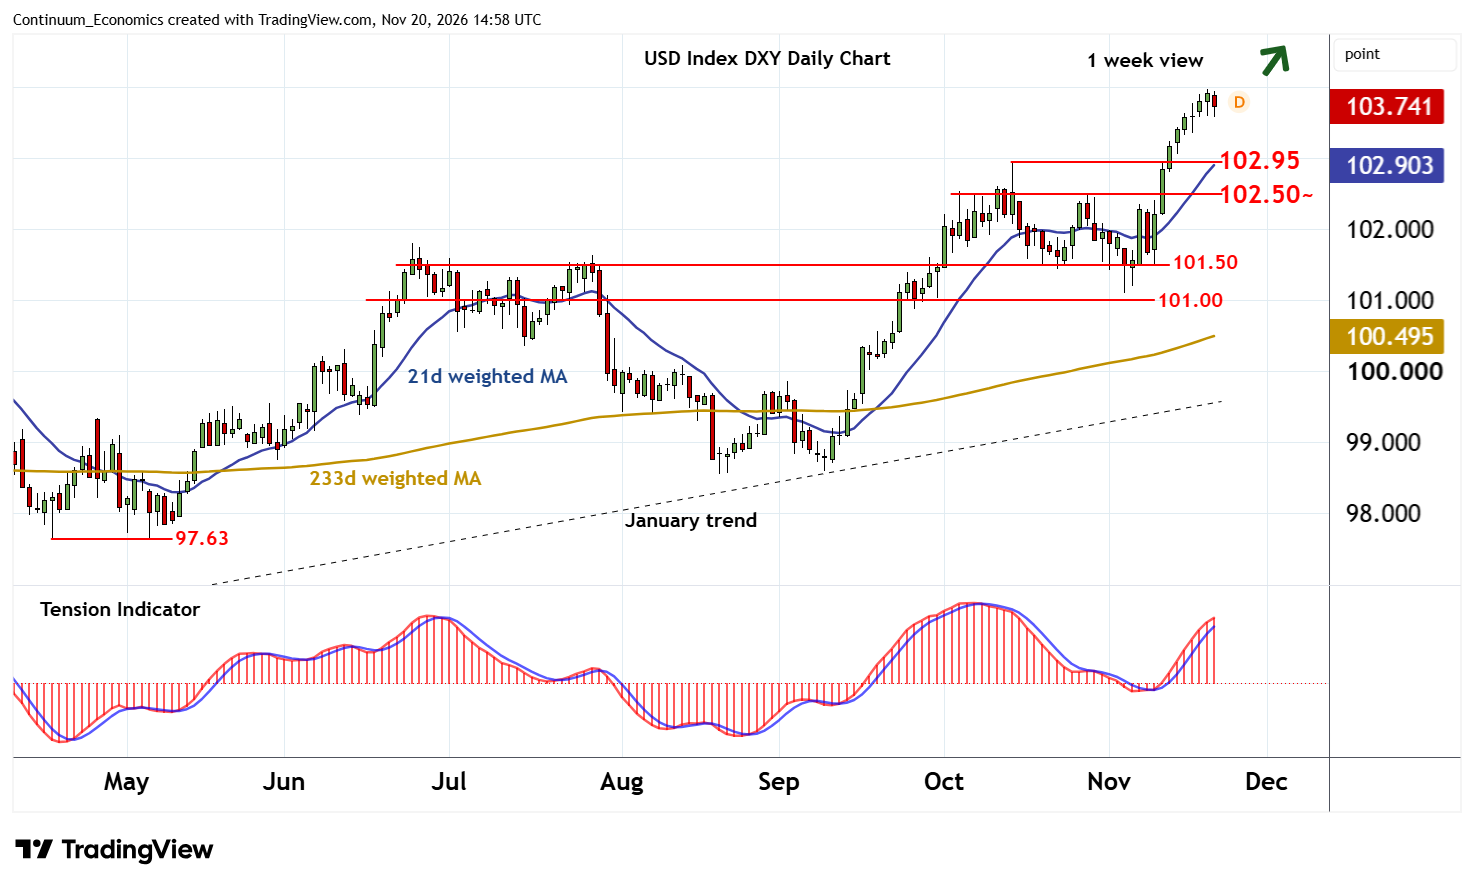
A tick lower in overbought daily stochastics suggests potential for a minor pullback towards here. However, the positive daily Tension Indicator and bullish longer-term charts should limit any setbacks in renewed buying interest/consolidation above here. A close below 102.95, however, will add weight to price action and open up risk of continuation below 102.50 into range extension above the 101.50 congestion lows.