Published: 2026-05-21T06:43:28.000Z
Chart AUD/NZD Update: Leaning lower from 1.2250 high
2
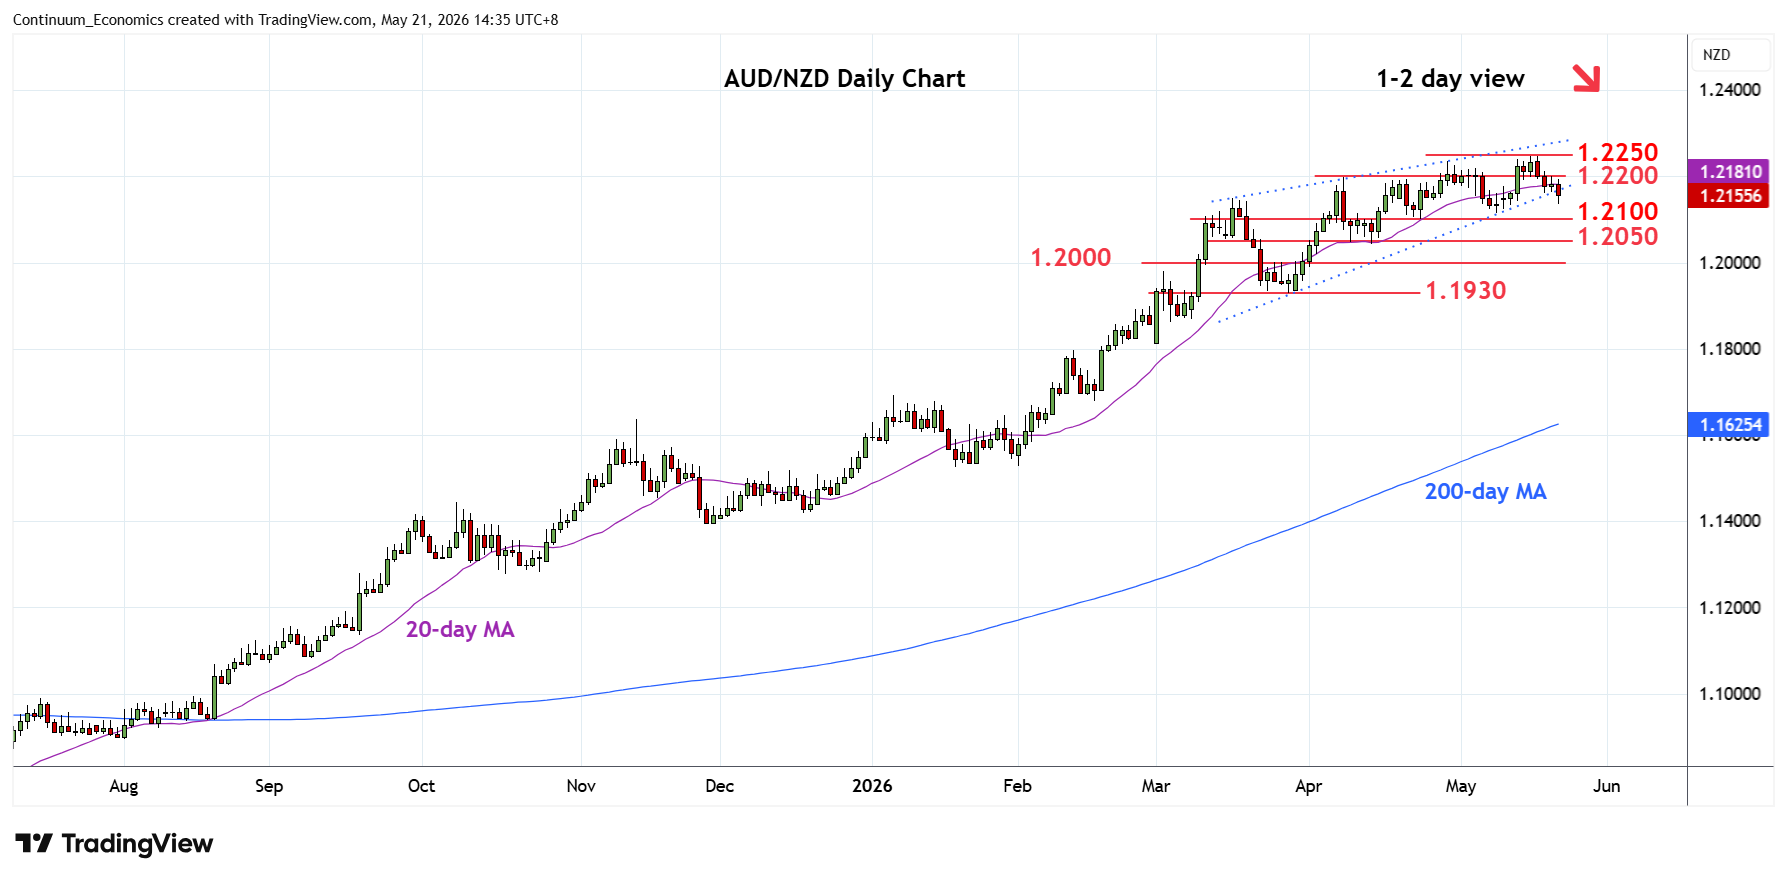
Leaning lower from the 1.2250 current year high to threaten deeper pullback to the strong support at the 1.2115/00 area
| Level | Comment | Level | Comment | |||||
|---|---|---|---|---|---|---|---|---|
| R4 | 1.2345 | * | 61.8% 2011/2020 fall | S1 | 1.2115/00 | ** | 8 May low, congestion | |
| R3 | 1.2300/10 | * | congestion, 2011 yr low | S2 | 1.2050 | ** | congestion | |
| R2 | 1.2250 | ** | 15 May YTD high | S3 | 1.2000 | * | congestion | |
| R1 | 1.2200 | congestion | S4 | 1.1930 | ** | 27 Mar low |
Asterisk denotes strength of level
06:40 GMT - Leaning lower from the 1.2250 current year high and break of the wedge pattern threatens deeper pullback to the strong support at the 1.2115/00 area. Daily and weekly studies are unwinding overbought readings and suggest scope for break here to open up room for deeper pullback to support at the 1.2050/1.2000 congestion area. Meanwhile, resistance at the 1.2200/1.2250 April and 15 May highs are expected to cap. Clearance will extend the broader gains from April 2025 year low and see room to the 1.2300 congestion and 1.2345, 61.8% Fibonacci retracement.