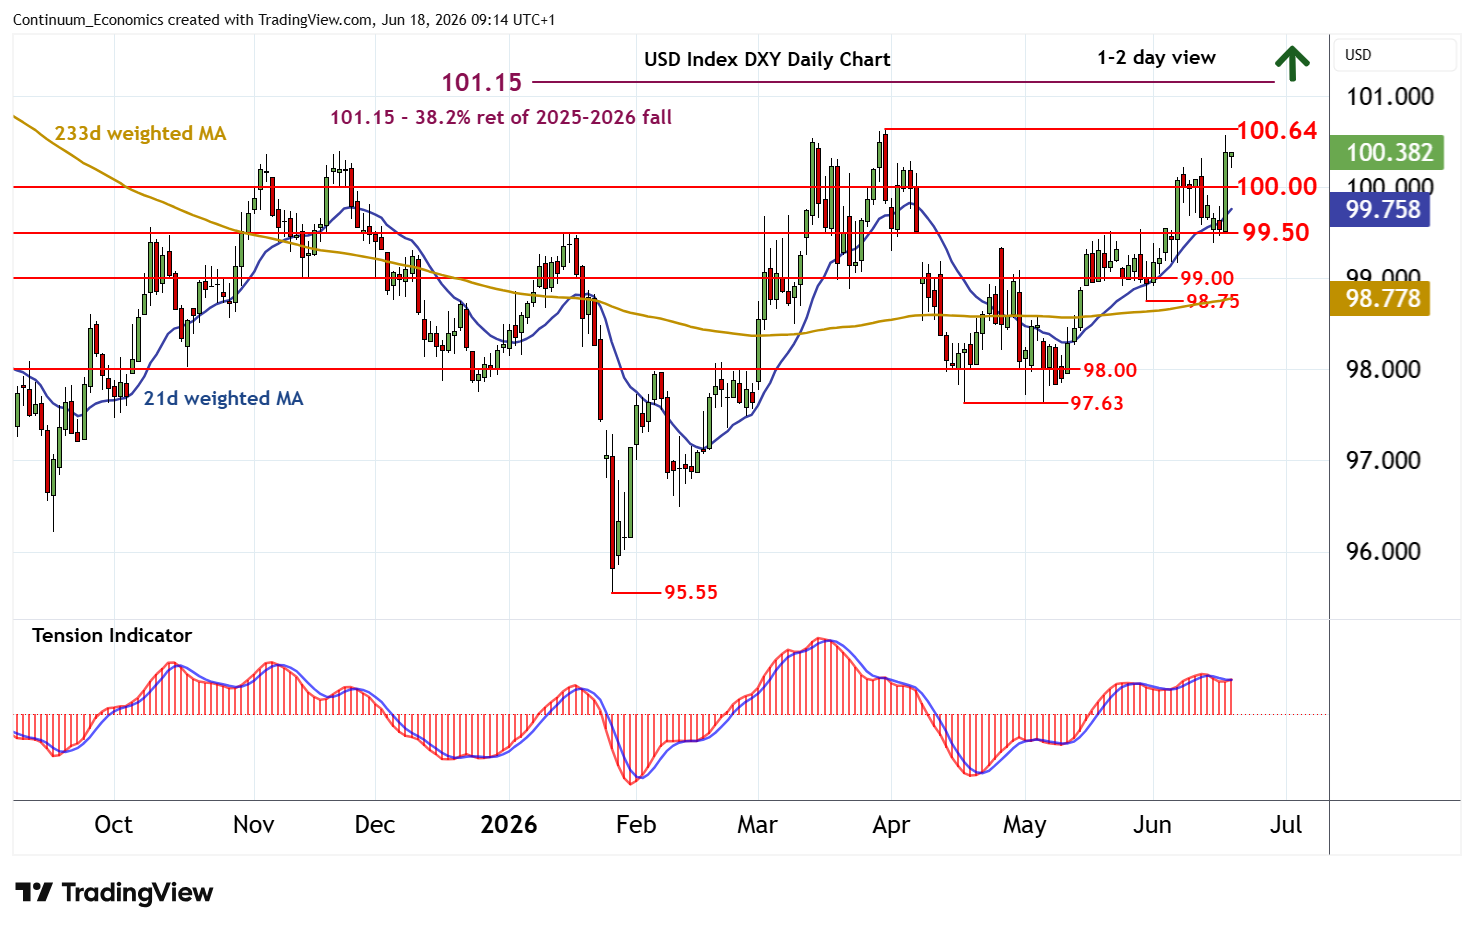
Chart USD Index DXY Update: Sharp run higher to current year highs
Cautious trade around congestion support at 99.50 has given way to a sharp break higher
| Levels | Imp | Comment | Levels | Imp | Comment | |||
|---|---|---|---|---|---|---|---|---|
| R4 | 102.85 | ** | 50% ret of 2025-2026 fall | S1 | 100.00 | ** | congestion | |
| R3 | 102.00 | ** | congestion | S2 | 99.50 | * | congestion | |
| R2 | 101.15 | ** | 38.2% ret of 2025-2026 fall | S3 | 99.00 | * | congestion | |
| R1 | 100.64 | ** | 31 Mar YTD high | S4 | 98.75 | 29 May (w) low |
Asterisk denotes strength of level
09:00 BST - Cautious trade around congestion support at 99.50 has given way to a sharp break higher, with prices reaching 100.57 before settling into consolidation around 100.35. Daily readings have ticked higher and broader weekly charts remain positive, highlighting room for further gains in the coming sessions. A close above critical resistance at the 100.64 current year high of 31 March will improve sentiment and extend late-January gains initially to the 101.15 Fibonacci retracement. Meanwhile, support is raised to congestion around 100.00. A close beneath here, if seen, will help to stabilise sentiment and prompt consolidation above further congestion around 99.50.