Published: 2026-07-07T07:35:25.000Z
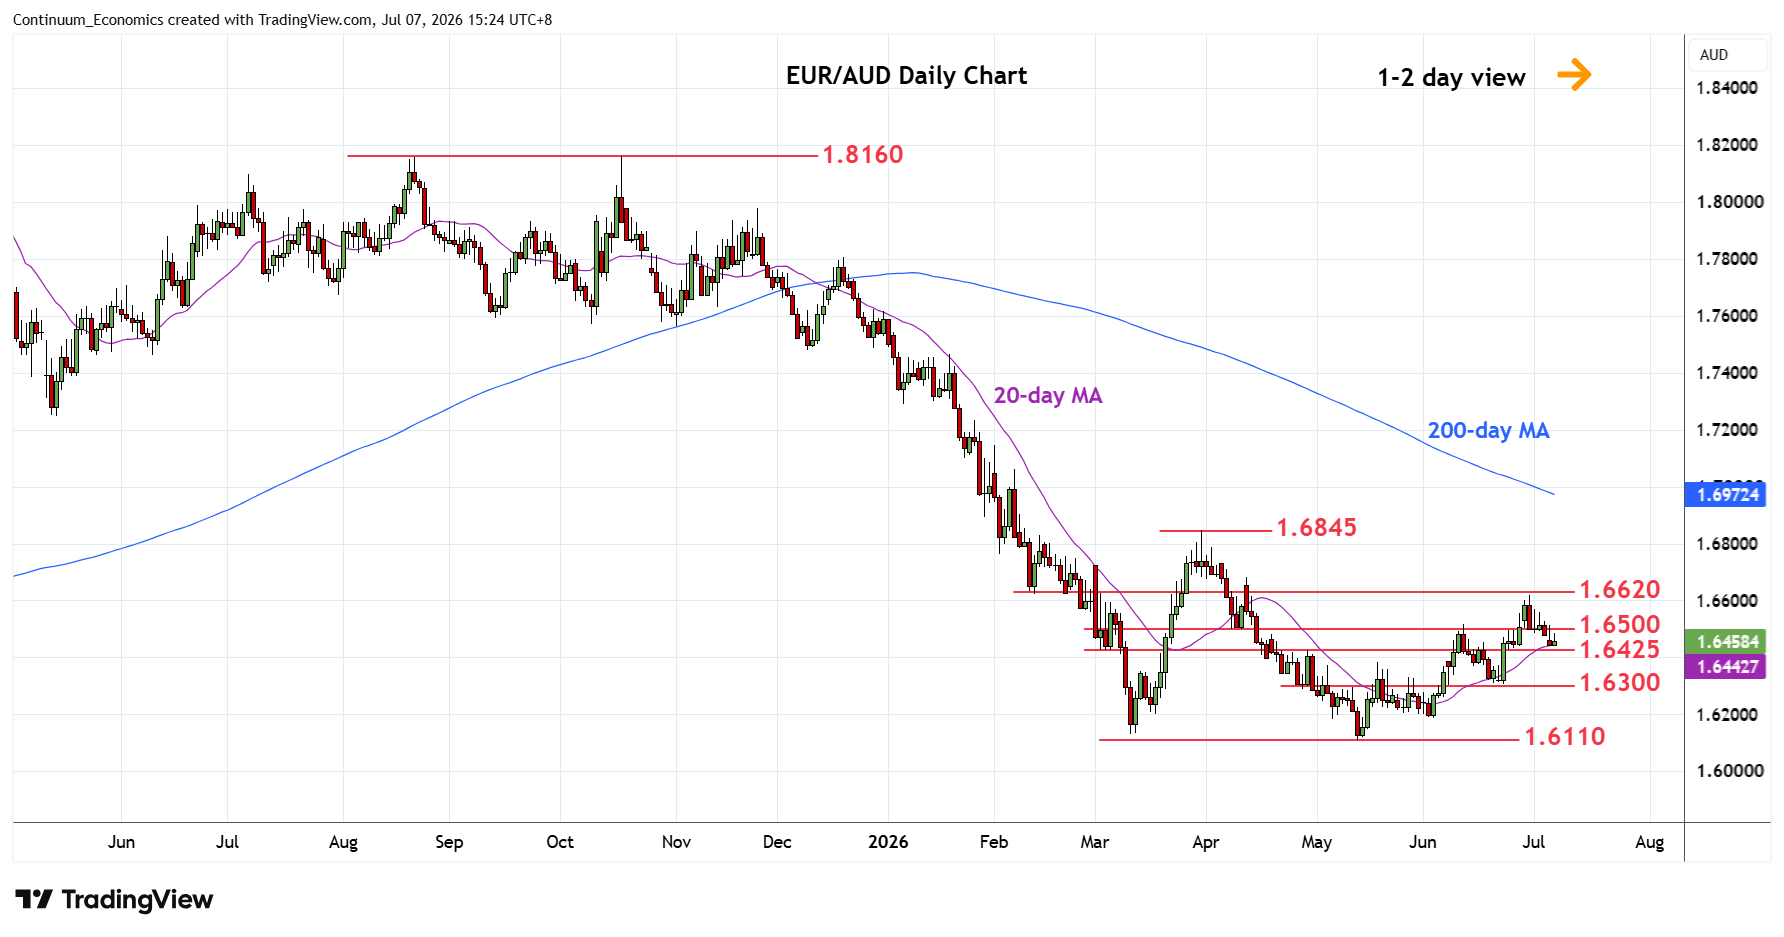
Chart EUR/AUD Update: Turned lower from 1.6600/20 resistance
1
Extending pullback from the 1.6600/20 resistance as daily studies unwind overbought readings through the 1.6500 level
| Levels | Imp | Comment | Levels | Imp | Comment | |||
|---|---|---|---|---|---|---|---|---|
| R4 | 1.6800 | * | congestion | S1 | 1.6425 | * | congestion | |
| R3 | 1.6700 | * | congestion | S2 | 1.6305/00 | ** | 23 Jun low, congestion | |
| R2 | 1.6600/20 | ** | congestion, 30 Jun high | S3 | 1.6200 | * | congestion | |
| R1 | 1.6500 | * | congestion | S4 | 1.6110 | ** | 13 May YTD low |
Asterisk denotes strength of level
07:30 GMT - Extending pullback from the 1.6600/20 resistance as daily studies unwind overbought readings through the 1.6500 level. Lower see room to support at the 1.6425 congestion then the 1.6305 low which is expected to underpin. Would take break here will return focus to the downside for retest of the 1.6200 congestion and 1.6110 13 May current year low. Meanwhile, resistance is lowered to 1.6500 congestion which is expected to cap and sustain pullback from strong resistance at the 1.6600/20 area.