Published: 2026-06-08T01:03:30.000Z
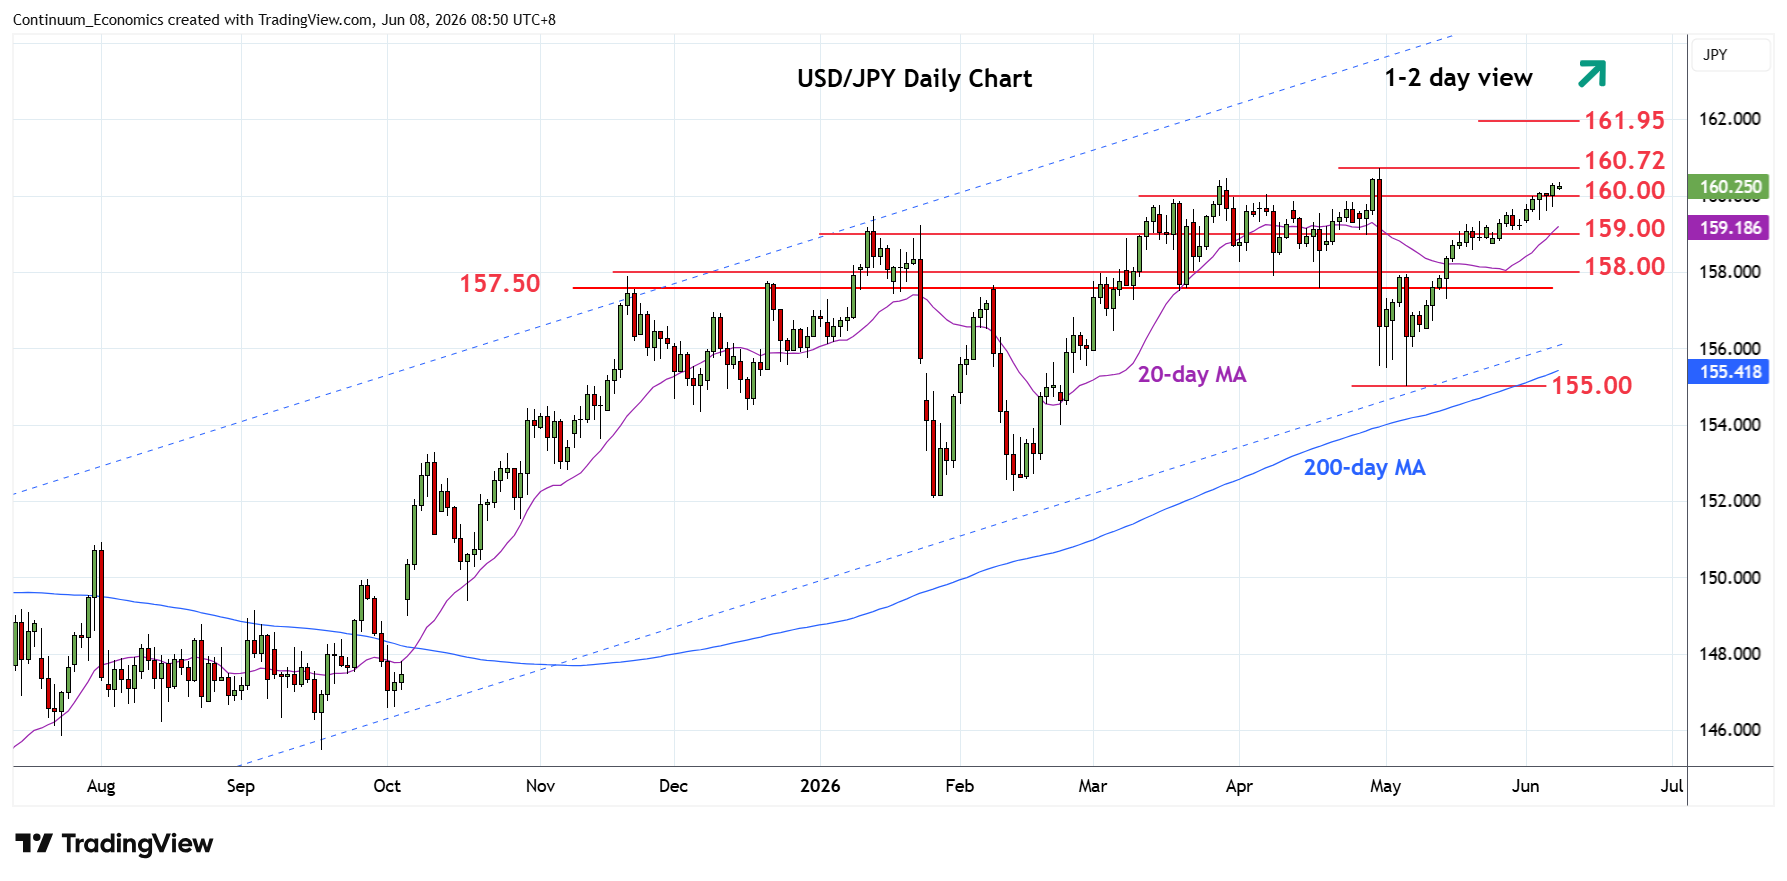
Chart USD/JPY Update: Within reach of 160.46/160.72, March/April highs
2
Pressure remains on the upside and gains above the 160.00 figure has reach 160.35 high
| Levels | Imp | Comment | Levels | Imp | Comment | |||
|---|---|---|---|---|---|---|---|---|
| R4 | 161.95 | ** | Jul 2024 multi-yr high | S1 | 159.00 | * | congestion | |
| R3 | 161.00 | * | figure | S2 | 158.60 | * | 18 May low | |
| R2 | 160.72 | ** | 30 Apr YTD high | S3 | 158.00 | * | congestion | |
| R1 | 160.46 | * | Mar high | S4 | 157.50 | ** | congestion |
Asterisk denotes strength of level
01:00 GMT - Pressure remains on the upside and gains above the 160.00 figure has reach 160.35 high. Nearby see room to resistance at the 160.46 March high. Above this will see scope for retest of the 160.72 April current year high. However, would expect these to cap and give way to fresh selling pressure later. Break, if seen, will turn focus to the 161.95, July 2024 year high. Meanwhile, support remains at the 159.00 congestion and this extend to the 158.60, 18 May low. Would take break here to fade the upside pressure and open up room for deeper pullback to retrace gains from 155.00 low.