Chart AUD/USD Update: Reached strong support
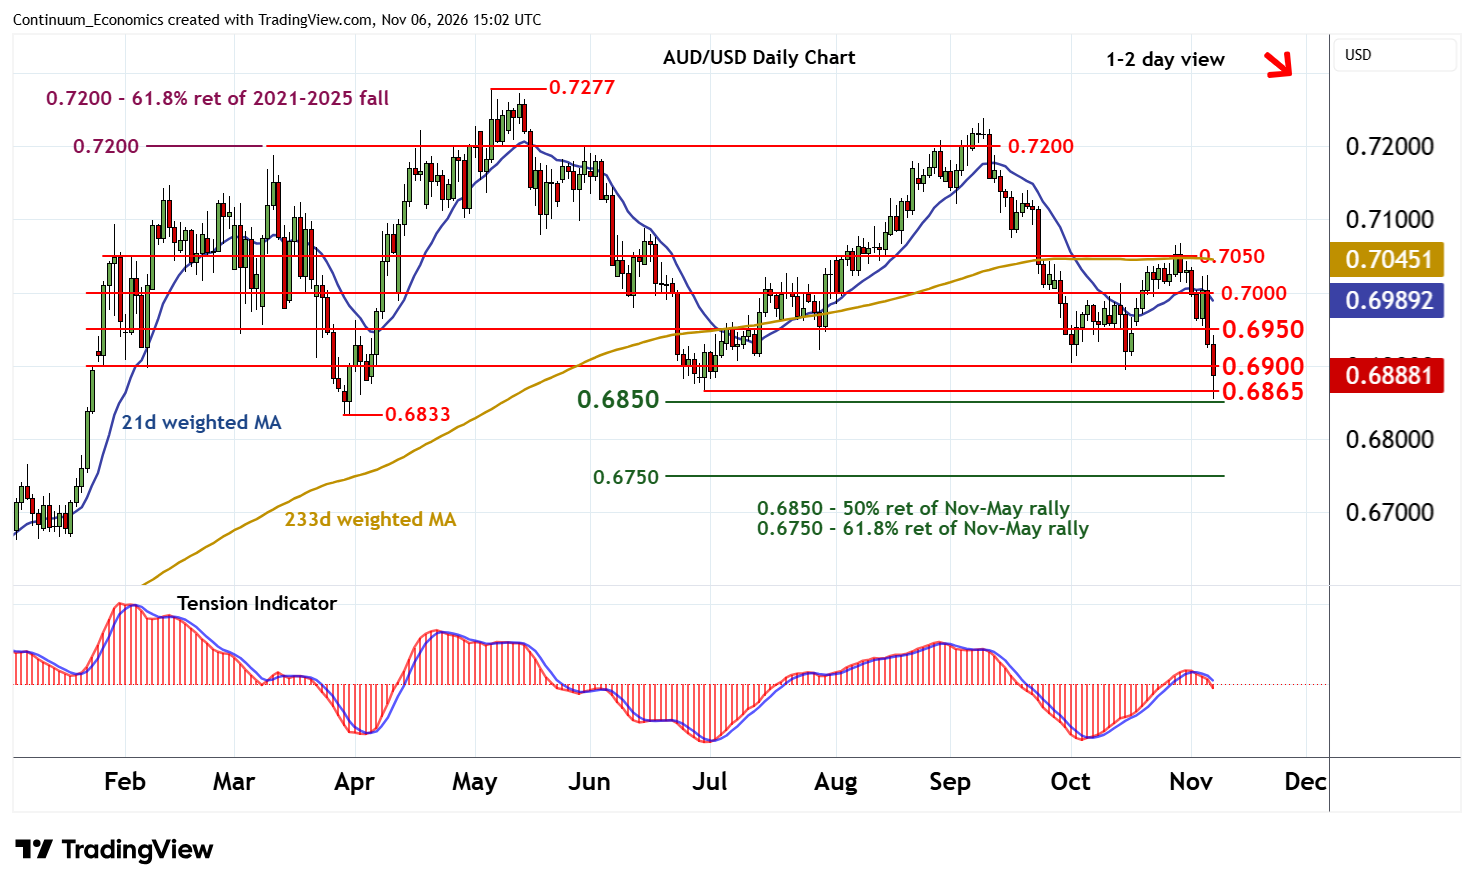
Anticipated losses have accelerated to test strong support within the 0.6850 Fibonacci retracement and the 0.6865 monthly low of 30 June
| Levels | Imp | Comment | Levels | Imp | Comment | |||
|---|---|---|---|---|---|---|---|---|
| R4 | 0.7050 | * | congestion | S1 | 0.6865 | ** | 30 Jun (m) low | |
| R3 | 0.7000 | * | congestion | S2 | 0.6850 | ** | 50% ret of Nov-May rally | |
| R2 | 0.6950 | * | break level | S3 | 0.6833 | ** | 30-31 Mar (m) lows | |
| R1 | 0.6900 | ** | congestion | S4 | 0.6800 | break level |
Asterisk denotes strength of level
14:45 GMT - Anticipated losses have accelerated to test strong support within the 0.6850 Fibonacci retracement and the 0.6865 monthly low of 30 June, before bouncing back towards congestion resistance at 0.6900. Daily stochastics and the daily Tension Indicator are under pressure and broader weekly charts are also turning down, suggesting any immediate tests above here should give way to renewed selling interest beneath 0.6950.
In the coming sessions, lower levels are looked for. However, a close below 0.6850/65 is needed to turn sentiment negative and confirm continuation of losses from the 0.7277 current year high of 6 May.