Published: 2026-10-15T13:39:39.000Z
Chart AUD/USD Update: Under pressure
1
Cautious trade has given way to a sharp break lower
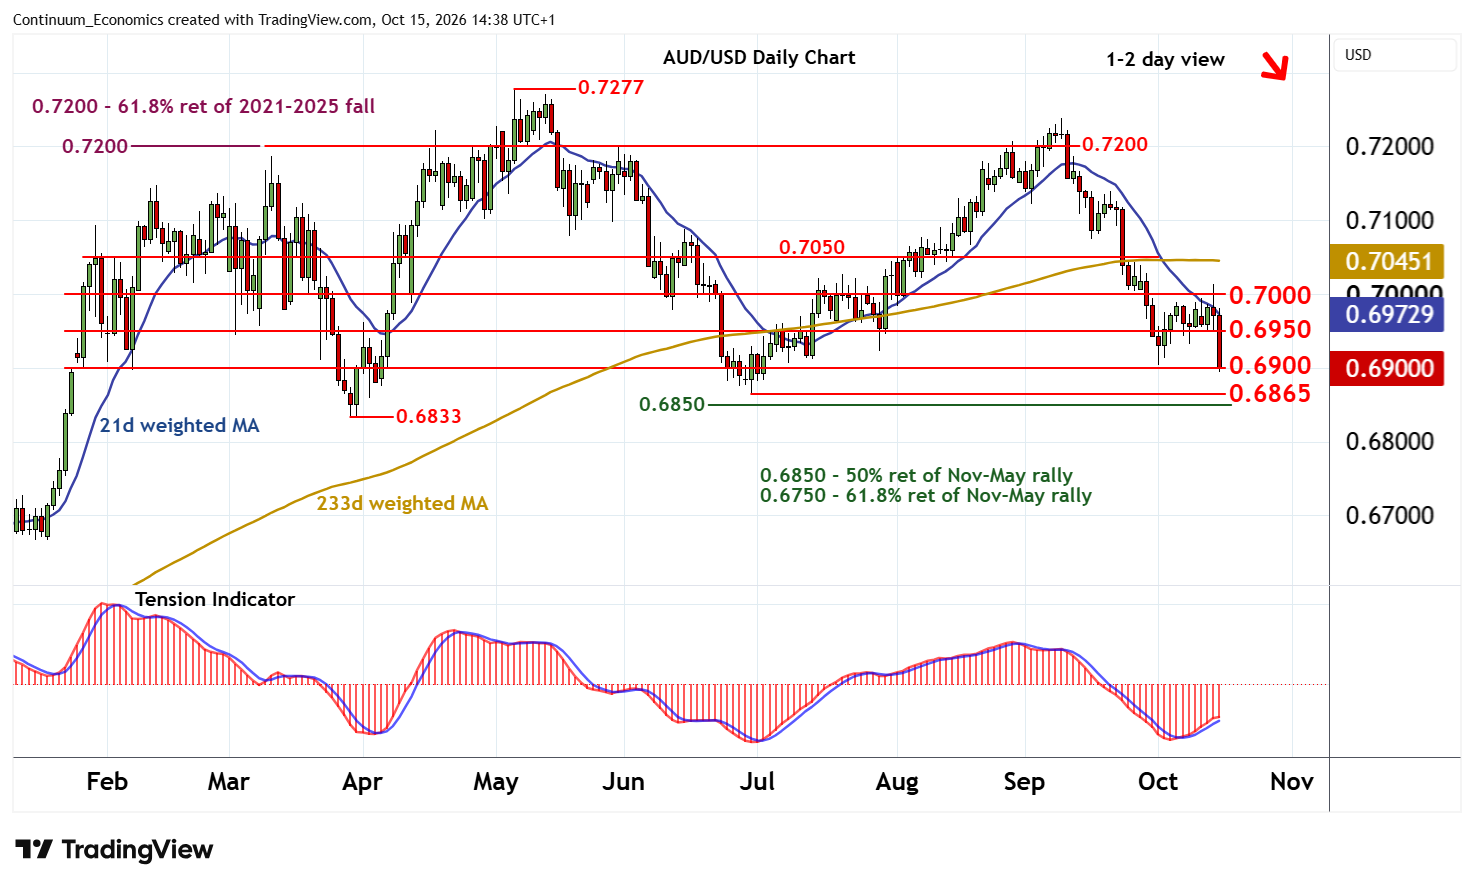
| Levels | Imp | Comment | Levels | Imp | Comment | |||
|---|---|---|---|---|---|---|---|---|
| R4 | 0.7100 | ** | congestion | S1 | 0.6900 | ** | congestion | |
| R3 | 0.7050 | * | congestion | S2 | 0.6865 | ** | 30 Jun (m) low | |
| R2 | 0.7000 | * | congestion | S3 | 0.6850 | ** | 50% ret of Nov-May rally | |
| R1 | 0.6950 | * | break level | S4 | 0.6833 | ** | 30-31 Mar (m) low |
Asterisk denotes strength of level
14:20 BST - Cautious trade has given way to a sharp break lower, with prices currently pressuring congestion support at 0.6900. Overbought daily stochastics are unwinding and the positive daily Tension Indicator is showing signs of flattening, suggesting room for continuation towards strong support at 0.6865 monthly low of 30 June. Broader weekly charts are bearish. But a close below the 0.6833 - 0.6850 range will complete a multi-month distribution top and extend May 2026 losses initially to 0.6800.
Meanwhile, a close back above resistance at 0.6950 will help to stabilise price action and extend consolidation beneath congestion resistance at 0.7000.