Published: 2026-06-08T02:04:39.000Z
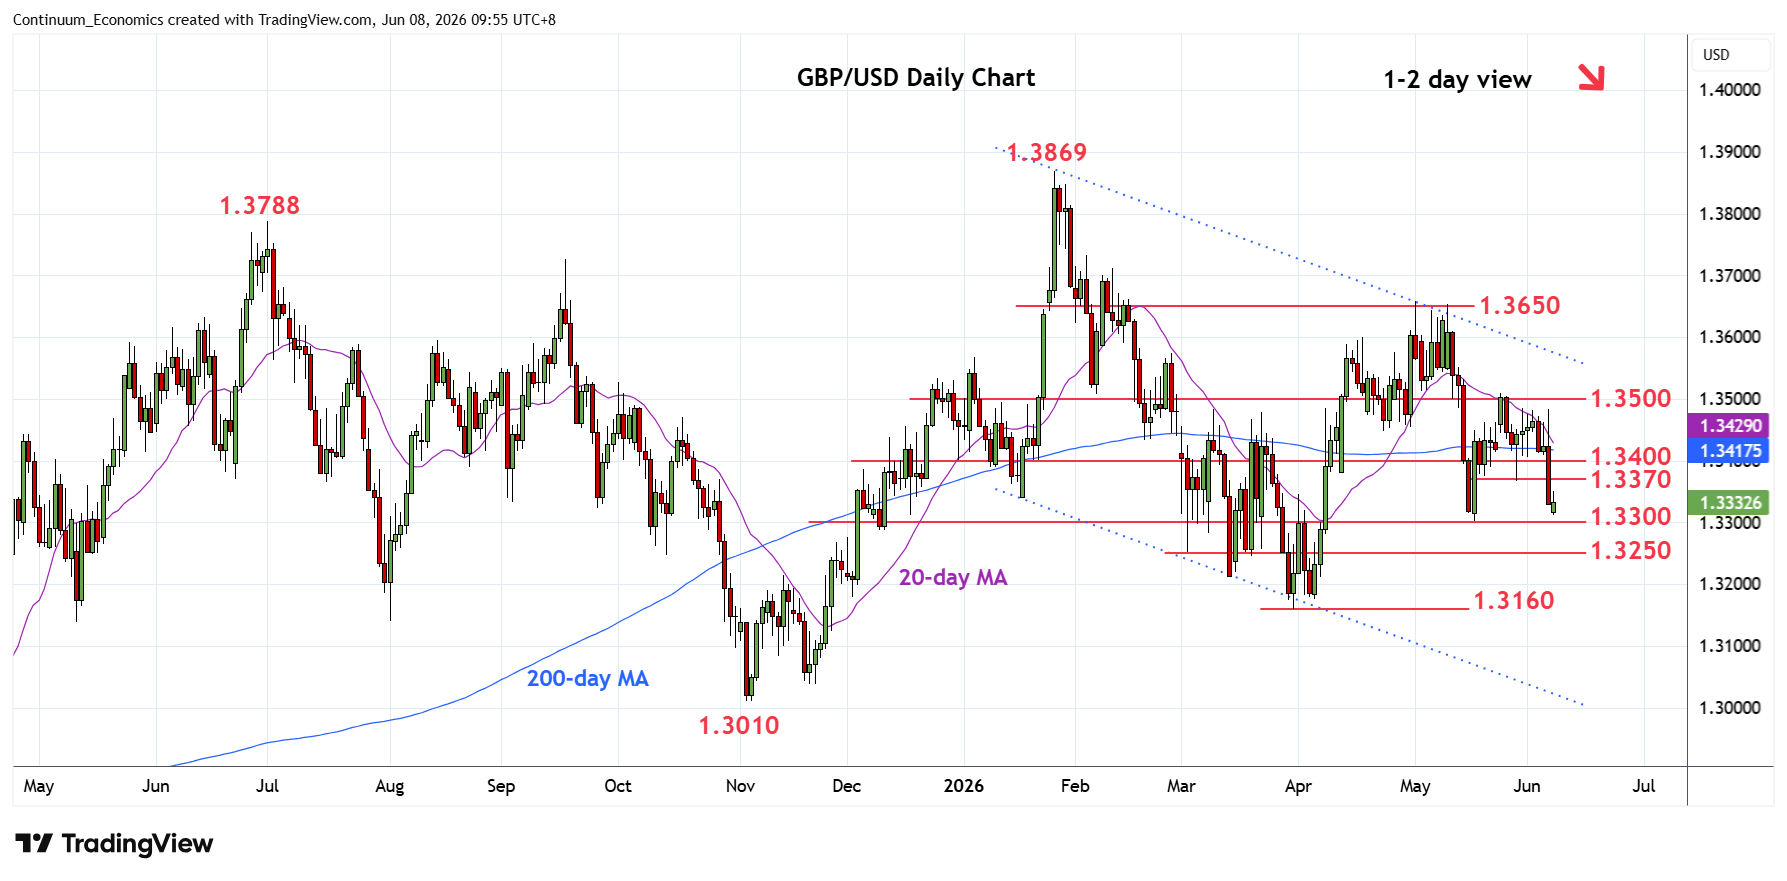
Chart GBP/USD Update: Consolidating above 1.3300
2
Gapped lower to 1.3312 low before turning up to consolidate losses last week from the 1.3485 resistance
| Level | Comment | Level | Comment | |||||
|---|---|---|---|---|---|---|---|---|
| R4 | 1.3485/00 | ** | 29 May high, congestion | S1 | 1.3300 | ** | May low, congestion | |
| R3 | 1.3415 | * | congestion, 200-day MA | S2 | 1.3250 | * | congestion | |
| R2 | 1.3400 | * | congestion | S3 | 1.3200 | * | congestion | |
| R1 | 1.3370 | * | 28 May low | S4 | 1.3160 | ** | 31 Mar YTD low |
Asterisk denotes strength of level
02:00 GMT - Gapped lower to 1.3312 low before turning up to consolidate losses last week from the 1.3485 resistance. However, pressure remains on the downside and consolidation expected to give way to renewed selling pressure later. Break of the 1.3300 level extend the broader losses from the 1.3650 May high and see room to 1.3250 congestion. Lower still, will see potential for retest of 1.3200 level then the 1.3160 March current year low. Meanwhile, resistance at the 1.3370/1.3400, 28 May low and congestion area, are expected to cap.