Published: 2026-07-03T11:58:26.000Z
Chart USD/ZAR Update: Under pressure
-
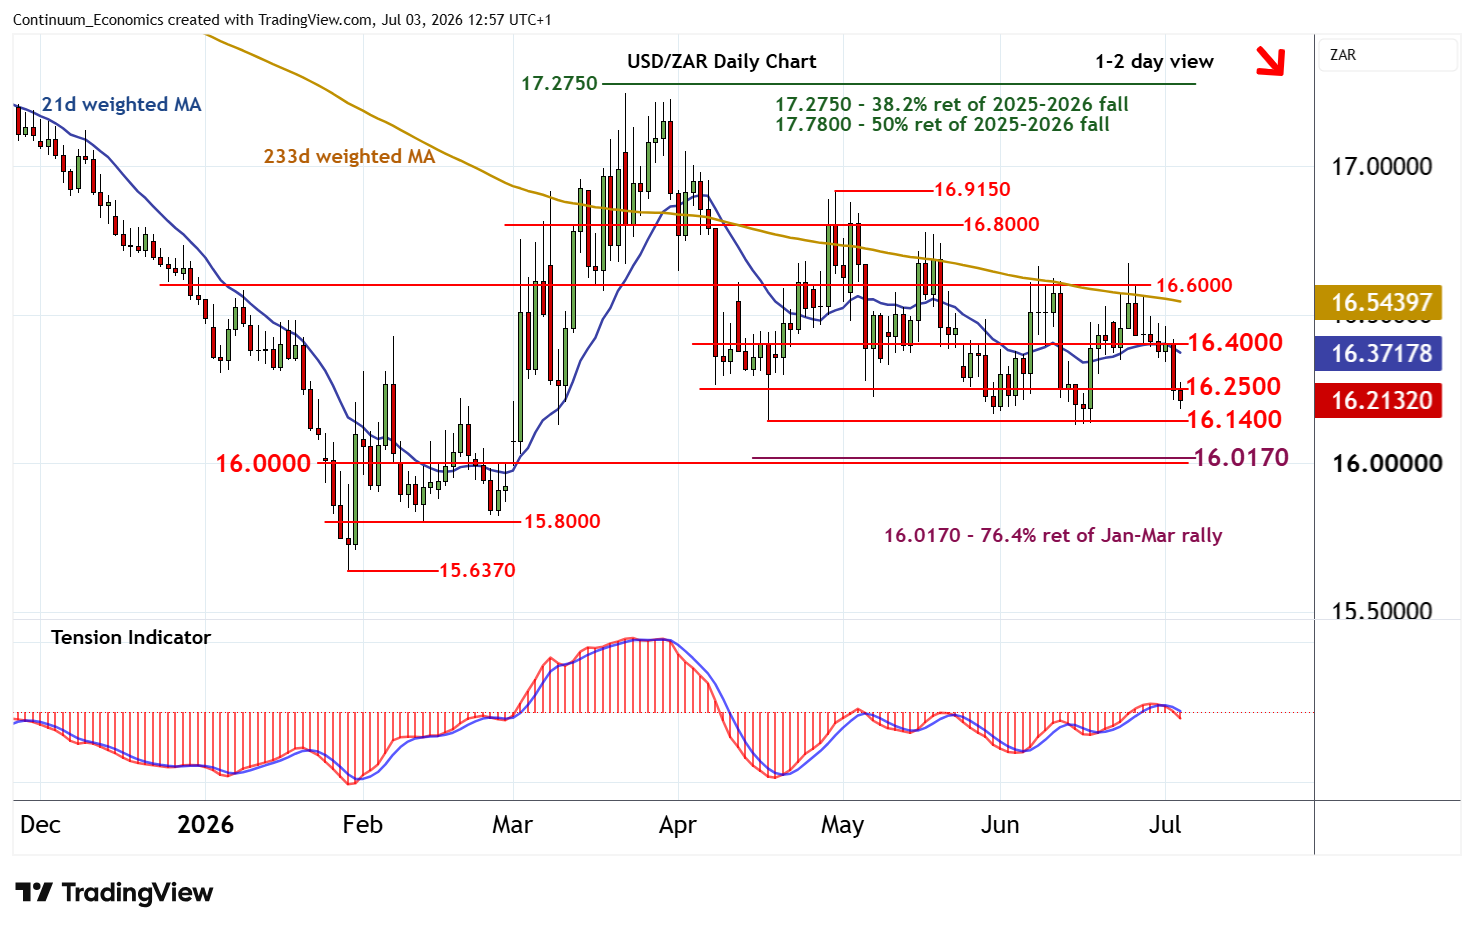
Cautious trade around 16.4000 has given way to anticipated selling pressure
| Level | Comment | Level | Comment | |||||
|---|---|---|---|---|---|---|---|---|
| R4 | 16.6750 | 24 Jun high | S1 | 16.1400 | ** | 17 Apr (m) low | ||
| R3 | 16.6000 | * | congestion | S2 | 16.0170 | ** | 76.4% ret of Jan-Mar rally | |
| R2 | 16.4000 | congestion | S3 | 16.0000 | ** | congestion | ||
| R1 | 16.2500 | * | congestion | S4 | 15.8000 | ** | Feb range lows |
Asterisk denotes strength of level
12:30 BST - Cautious trade around 16.4000 has given way to anticipated selling pressure, with prices currently trading below 16.2500. Daily readings are under pressure and broader weekly charts are mixed/negative, highlighting room for a test of support at the 16.1400 monthly low of 17 April. A further break will open up the 16.0000 -16.0170 range. But by-then oversold daily stochastics could limit any initial tests in short-covering/consolidation. Meanwhile, a close above congestion resistance at 16.2500 will help to stabilise price action and prompt consolidation beneath further congestion around 16.4000.