Published: 2026-06-10T01:59:35.000Z
Chart GBP/USD Update: Extend bounce from 1.3300 support
2
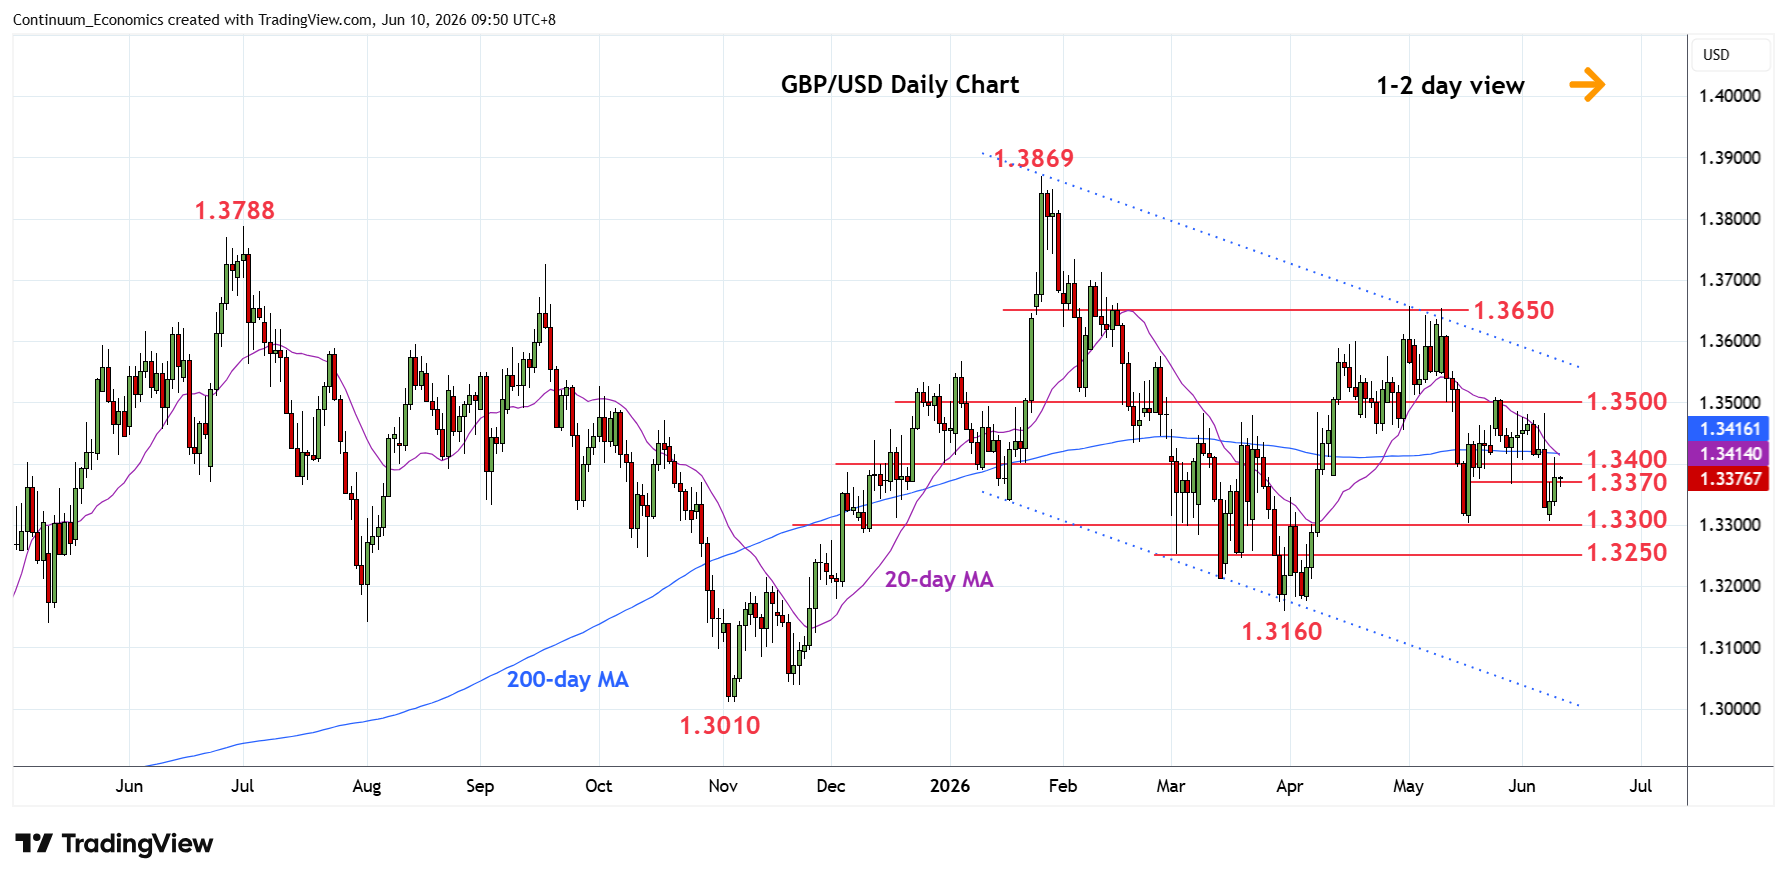
Extending bounce from above the 1.3300 support to reach resistance at 1.3400 congestion
| Level | Comment | Level | Comment | |||||
|---|---|---|---|---|---|---|---|---|
| R4 | 1.3550 | * | congestion | S1 | 1.3300 | ** | May low, congestion | |
| R3 | 1.3485/00 | ** | 29 May high, congestion | S2 | 1.3250 | * | congestion | |
| R2 | 1.3415 | * | congestion, 200-day MA | S3 | 1.3200 | * | congestion | |
| R1 | 1.3400 | * | congestion | S4 | 1.3160 | ** | 31 Mar YTD low |
Asterisk denotes strength of level
01:50 GMT - Extending bounce from above the 1.3300 support to reach resistance at 1.3400 congestion. Bounce see prices unwinding oversold daily studies and lift over this will open up room for retest of strong resistance at the 1.3485/1.3500 area. Consolidation is expected to give way to renewed selling pressure later and break of the 1.3300 level will extend the broader losses from the 1.3650 May swing high/channel resistance and see room to 1.3250 congestion. Below the latter will see potential for retest of 1.3200 level then the 1.3160 March current year low.