Published: 2026-06-11T00:56:49.000Z
Chart USD/JPY Update: Within reach of 160.72 high
2
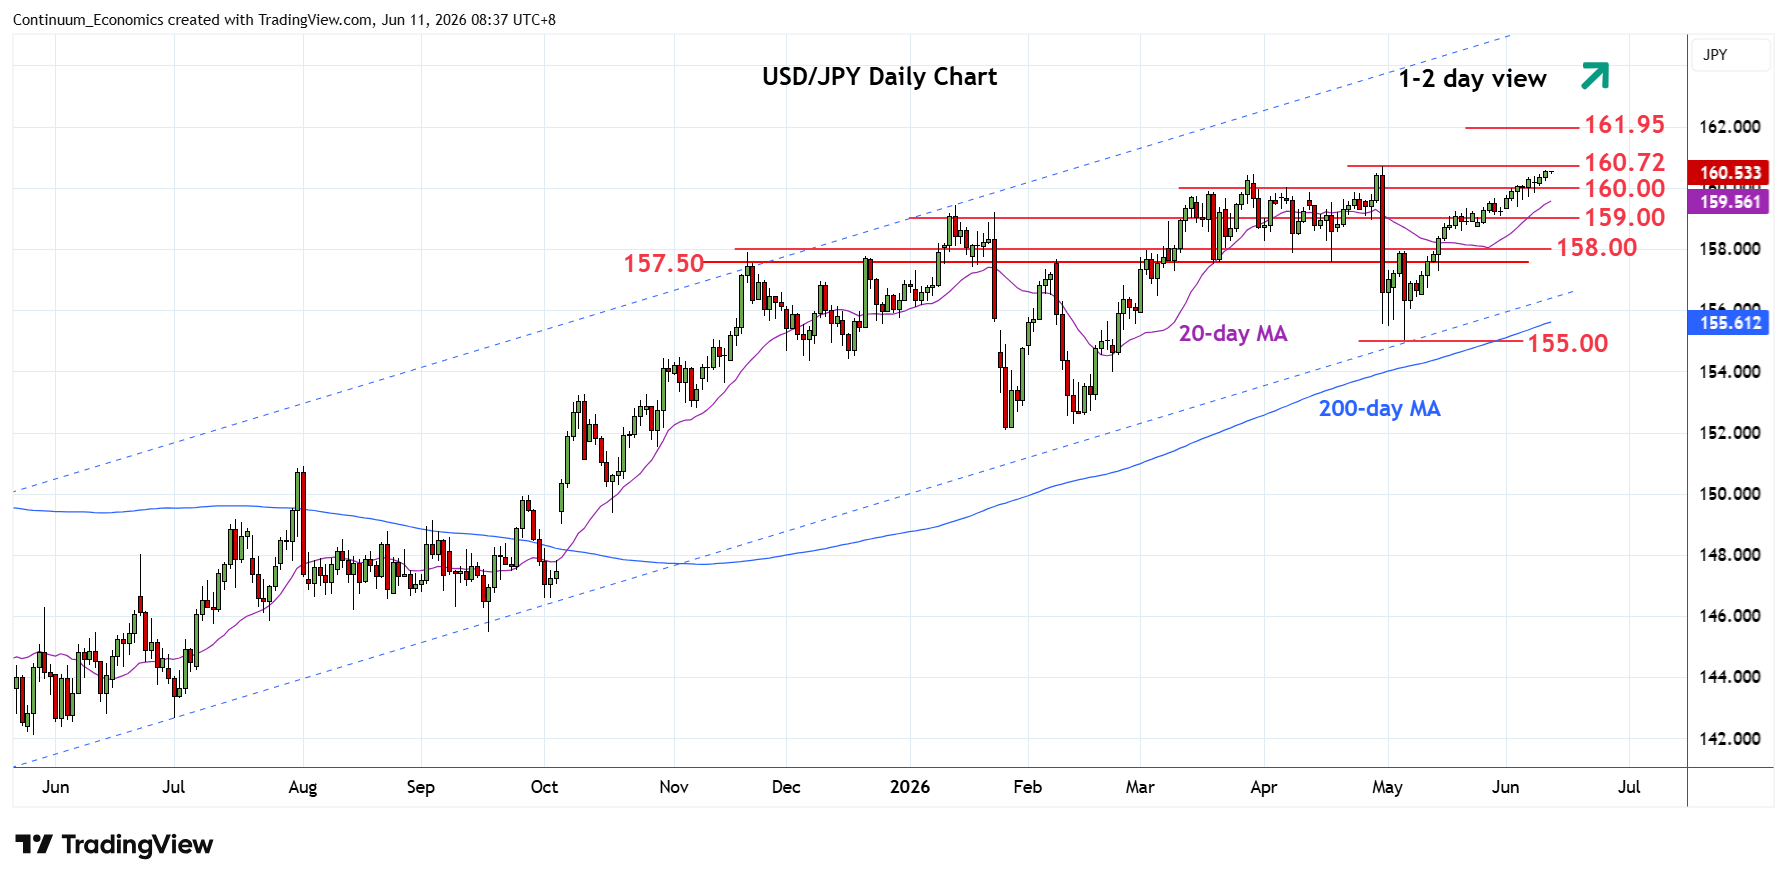
Pressure remains on the upside as prices extend gains from the 155.00 May low towards retest of the 160.72 April current year high
| Levels | Imp | Comment | Levels | Imp | Comment | |||
|---|---|---|---|---|---|---|---|---|
| R4 | 163.00 | * | congeastion Dec 1986 | S1 | 160.00 | * | figure, congestion | |
| R3 | 161.95 | ** | Jul 2024 multi-yr high | S2 | 159.00 | * | congestion | |
| R2 | 161.00 | * | figure | S3 | 158.60 | * | 18 May low | |
| R1 | 160.72 | ** | 30 Apr YTD high | S4 | 158.00 | ** | congestion |
Asterisk denotes strength of level
00:45 GMT - Pressure remains on the upside as prices extend gains from the 155.00 May low towards retest of the 160.72 April current year high. Would expect reaction here but a later break cannot be ruled out. Clearance, if seen, will extend the broader gains from 2024 year low and see room to retest 161.95, July 2024 multi-year high. Meanwhile, support is raised to the 160.00 figure. Would take break here to ease the upside pressure and see room for deeper pullback to support at the 159.00/158.60 congestion and 18 May low.