Chart USD/CAD Update: Consolidating - background studies under pressure
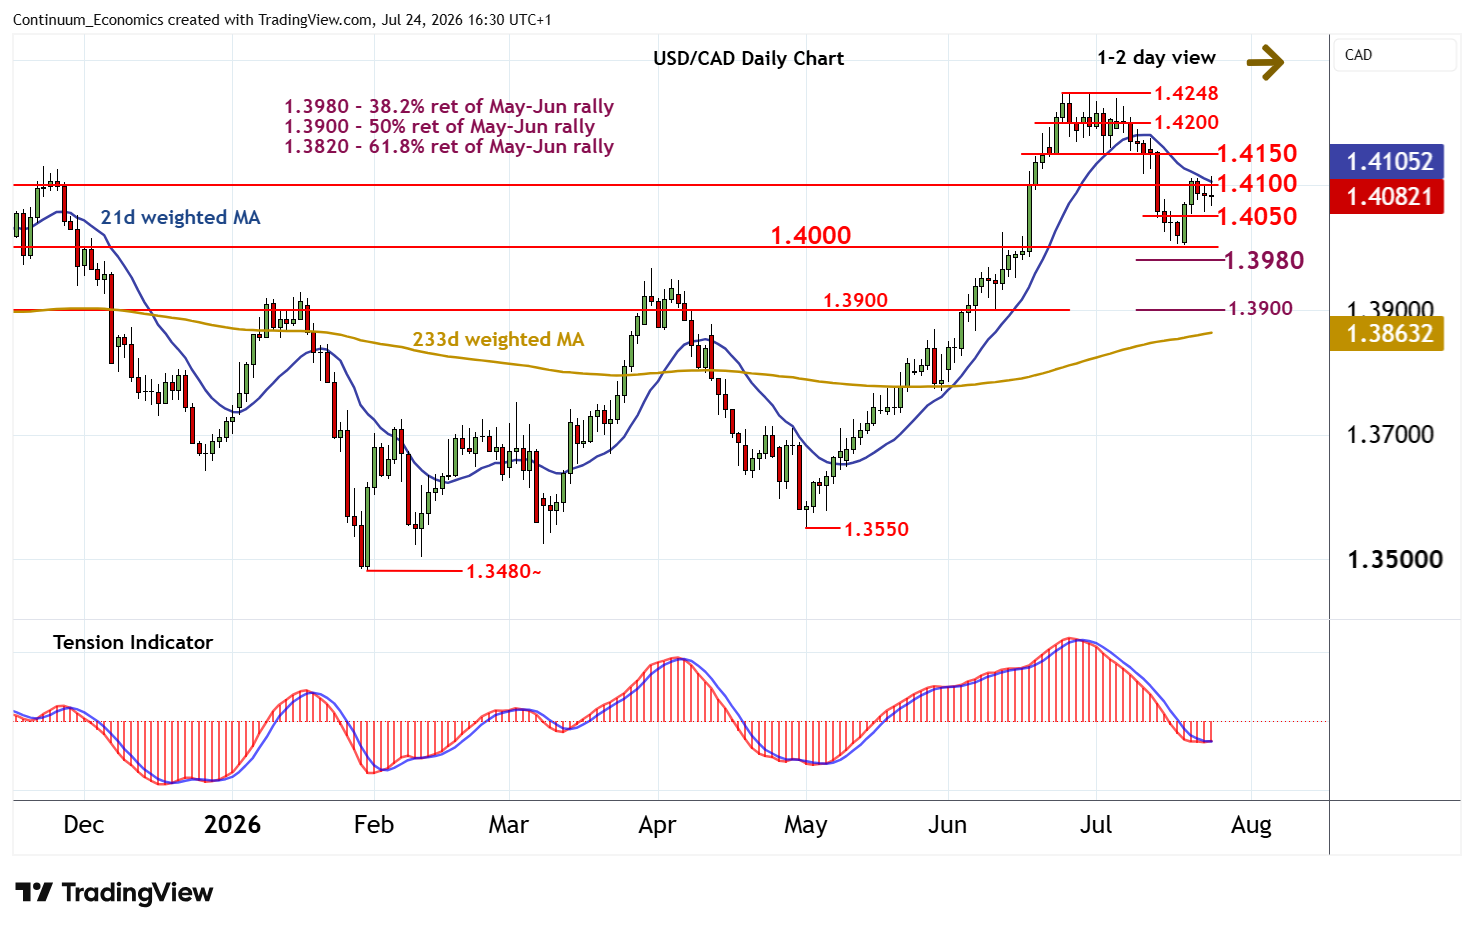
Still little change, as the test above congestion resistance at 1.4100 gives way to a pullback into renewed consolidation within the 1.4050 - 1.4100 range
| Levels | Imp | Comment | Levels | Imp | Comment | |||
|---|---|---|---|---|---|---|---|---|
| R4 | 1.4248 | ** | 24 Jun YTD high | S1 | 1.4050 | break level | ||
| R3 | 1.4200 | ** | congestion | S2 | 1.4000 | ** | break level | |
| R2 | 1.4150 | * | congestion base | S3 | 1.3980 | ** | 38.2% ret of May-Jun rally | |
| R1 | 1.4100 | * | congestion | S4 | 1.3930 | intraday lows |
Asterisk denotes strength of level
16:20 BST - Still little change, as the test above congestion resistance at 1.4100 gives way to a pullback into renewed consolidation within the 1.4050 - 1.4100 range. Daily stochastics are turning down and the daily Tension Indicator is flat, suggesting room for further range trade. But bearish weekly charts point to later losses and a break below 1.4050 towards stronger support at the 1.4000 break level and the 1.3980 Fibonacci retracement. A close beneath here would add weight to sentiment and extend June losses towards strong support at 1.3900. Meanwhile, a retest above 1.4100, if seen, should be limited in renewed selling interest beneath 1.4150.