Published: 2026-06-03T00:47:05.000Z
Chart USD/JPY Update: Up to tag 160.00 figure
1
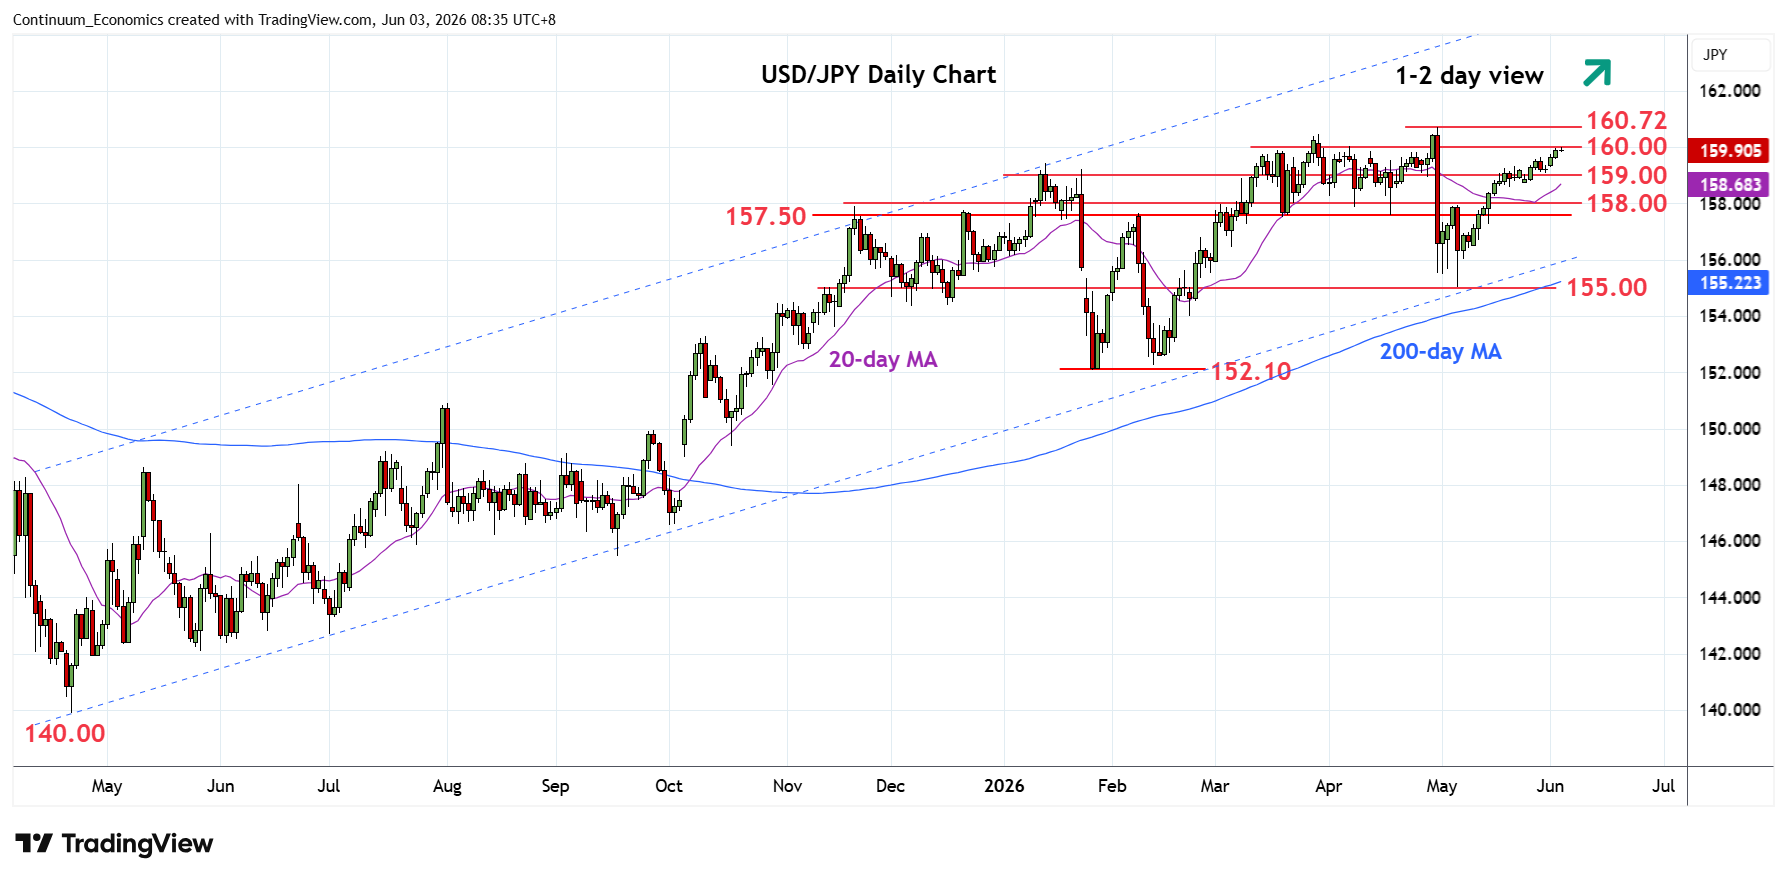
Extending gains to reach the 160.00 figure where reaction can be expected
| Levels | Imp | Comment | Levels | Imp | Comment | |||
|---|---|---|---|---|---|---|---|---|
| R4 | 161.95 | ** | Jul 2024 multi-yr high | S1 | 159.00 | * | congestion | |
| R3 | 160.72 | ** | 30 Apr YTD high | S2 | 158.60 | * | 18 May low | |
| R2 | 160.46 | * | Mar high | S3 | 158.00 | * | congestion | |
| R1 | 160.00 | ** | figure, congestion | S4 | 157.50 | ** | congestion |
Asterisk denotes strength of level
00:40 GMT - Extending gains to reach the 160.00 figure where reaction can be expected. However, bullish gains from the 155.00 May low suggest scope for break later to open up room for retest resistance at 160.46/160.72, March and April current year high. Would expect these to cap and give way to fresh selling pressure later. Meanwhile, support is raised to the 159.00 congestion and this extend to the 158.60, 18 May low. Would take break of these to fade the upside pressure and open up room for deeper pullback to the strong support at the 158.00/157.50 area.