Published: 2026-06-10T01:42:00.000Z
Chart EUR/USD Update: Higher in consolidation from 1.1500
1
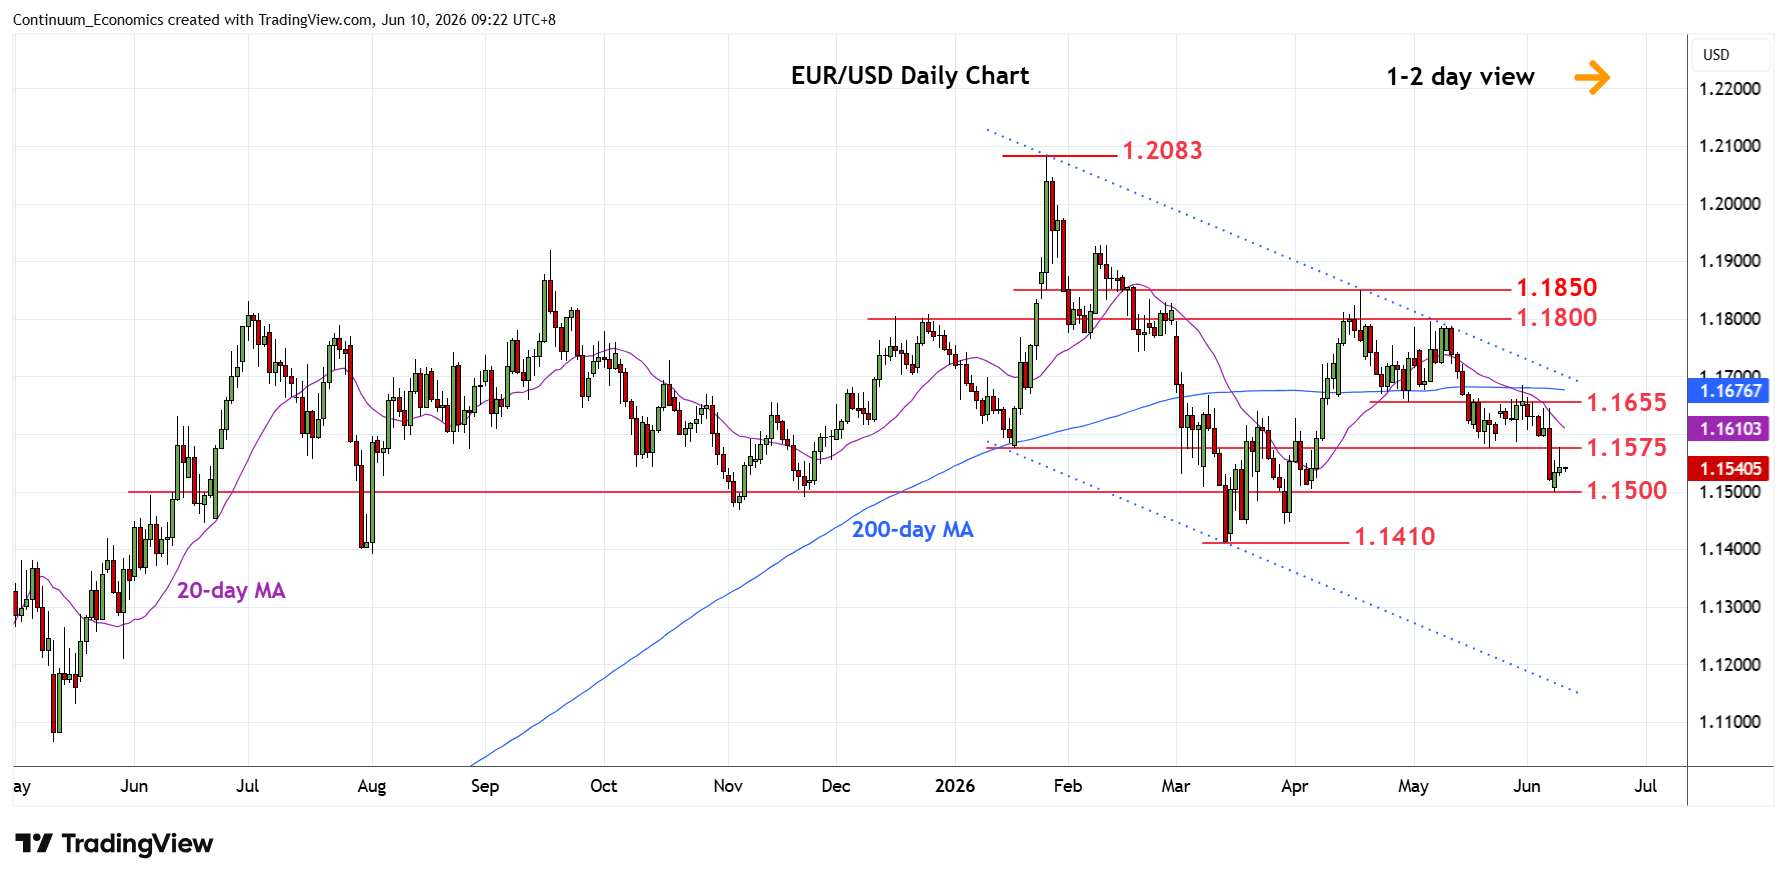
Higher in consolidation following bounce from the 1.1500 support as prices consolidate losses from the 1.1655/85 area
| Levels | Imp | Comment | Levels | Imp | Comment | |||
|---|---|---|---|---|---|---|---|---|
| R4 | 1.1678/85 | * | 200-day MA, 29 May high | S1 | 1.1500 | ** | congestion | |
| 14 | 1.1655 | ** | 30 Apr low | S2 | 1.1450 | * | congestion | |
| R2 | 1.1600 | congestion | S3 | 1.1410 | ** | 13 Mar YTD low | ||
| R1 | 1.1550/75 | ** | congestion, 21 May low | S4 | 1.1355 | * | 38.2% 2025/Jan rally |
Asterisk denotes strength of level
01:35 GMT - Higher in consolidation following bounce from the 1.1500 support as prices consolidate losses from the 1.1655/85 area. Consolidation is expected to give way to renewed selling pressure later and lower will see room to support at the 1.1450 congestion then the 1.1410, March current year low. Meanwhile, resistance remains at the 1.1550/75 congestion and this extend to the 1.1600 level. These are expected to cap and only above the latter will ease the downside pressure and see room for stronger bounce to retest resistance at 1.1655.