Chart USD Index DXY Update: Choppy in range
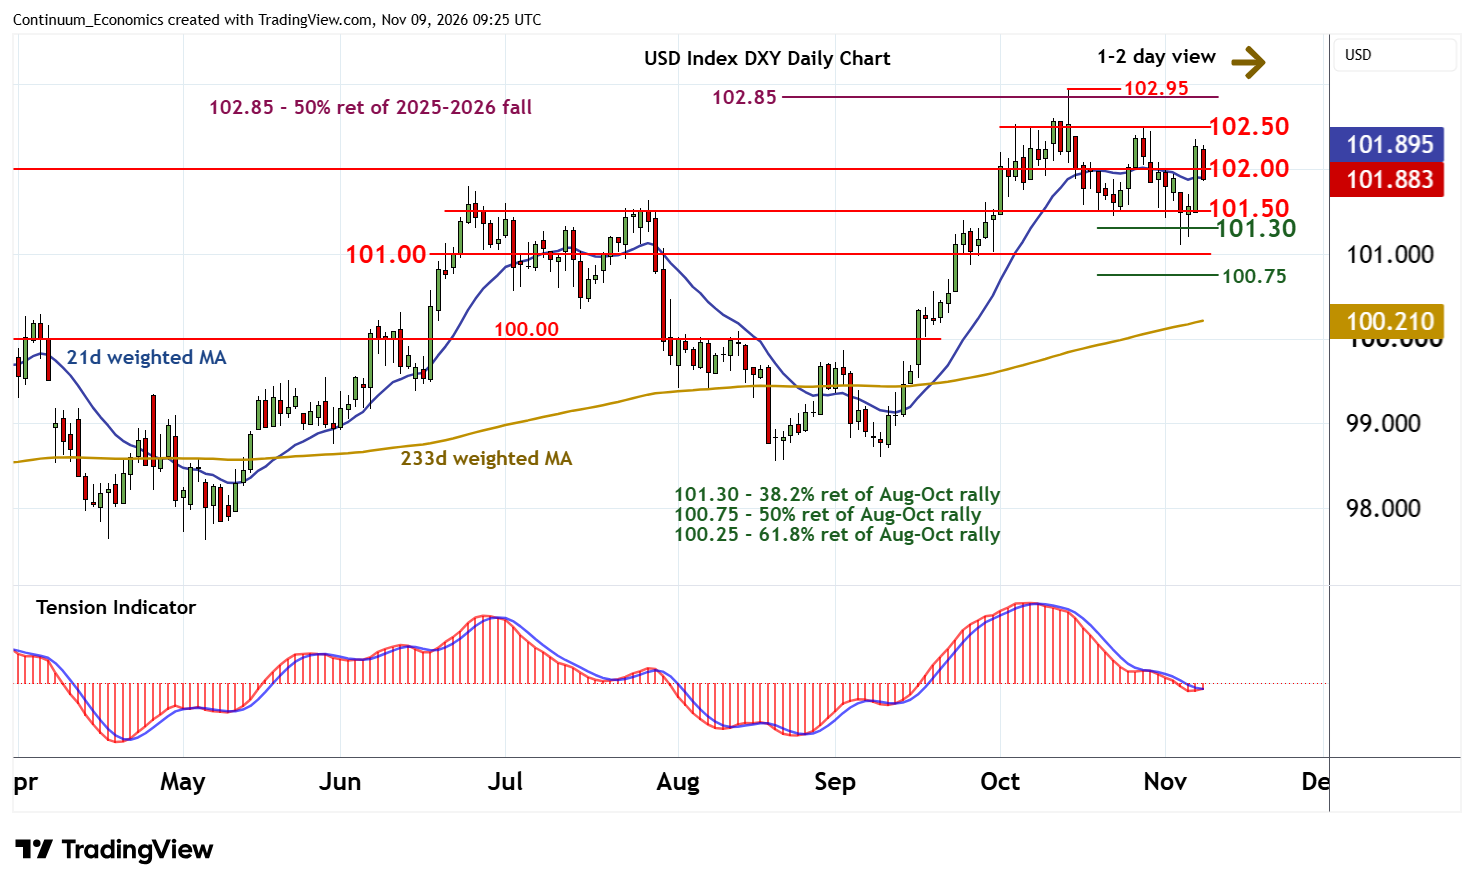
The sharp break above 102.00 has been pushed back from 102.35
| Levels | Imp | Comment | Levels | Imp | Comment | |||
|---|---|---|---|---|---|---|---|---|
| R4 | 102.95/00 | ** | 14 Oct YTD high; congestion | S1 | 101.50 | * | break level | |
| R3 | 102.85 | ** | 50% ret of 2025-2026 fall | S2 | 101.30 | * | 38.2% ret of Aug-Oct rally | |
| R2 | 102.50 | congestion | S3 | 101.00 | ** | congestion | ||
| R1 | 102.00 | ** | congestion | S4 | 100.75 | * | 50% ret of Aug-Oct rally |
Asterisk denotes strength of level
09:15 GMT - The sharp break above 102.00 has been pushed back from 102.35, overbought intraday studies unwind, with steady selling interest prompting a break back below 102.00. Prices are currently trading around 101.90. But improving daily readings should limit any deeper losses in renewed consolidation above support at 101.50.
Meanwhile, mixed weekly charts should limit any immediate tests back above congestion resistance at 102.00 in fresh consolidation beneath congestion around 102.50. A close above 102.50, however, would improve sentiment and put focus back on critical resistance at the 102.85 Fibonacci retracement and the 102.95 current year high of 14 October.