Published: 2026-06-09T12:23:26.000Z
Chart USD/ZAR Update: Recent gains giving way to consolidation
1
The break higher has reached 16.6630, where negative intraday studies are prompting profit-taking and pullback into consolidation within the 16.4000 - 16.6000 range
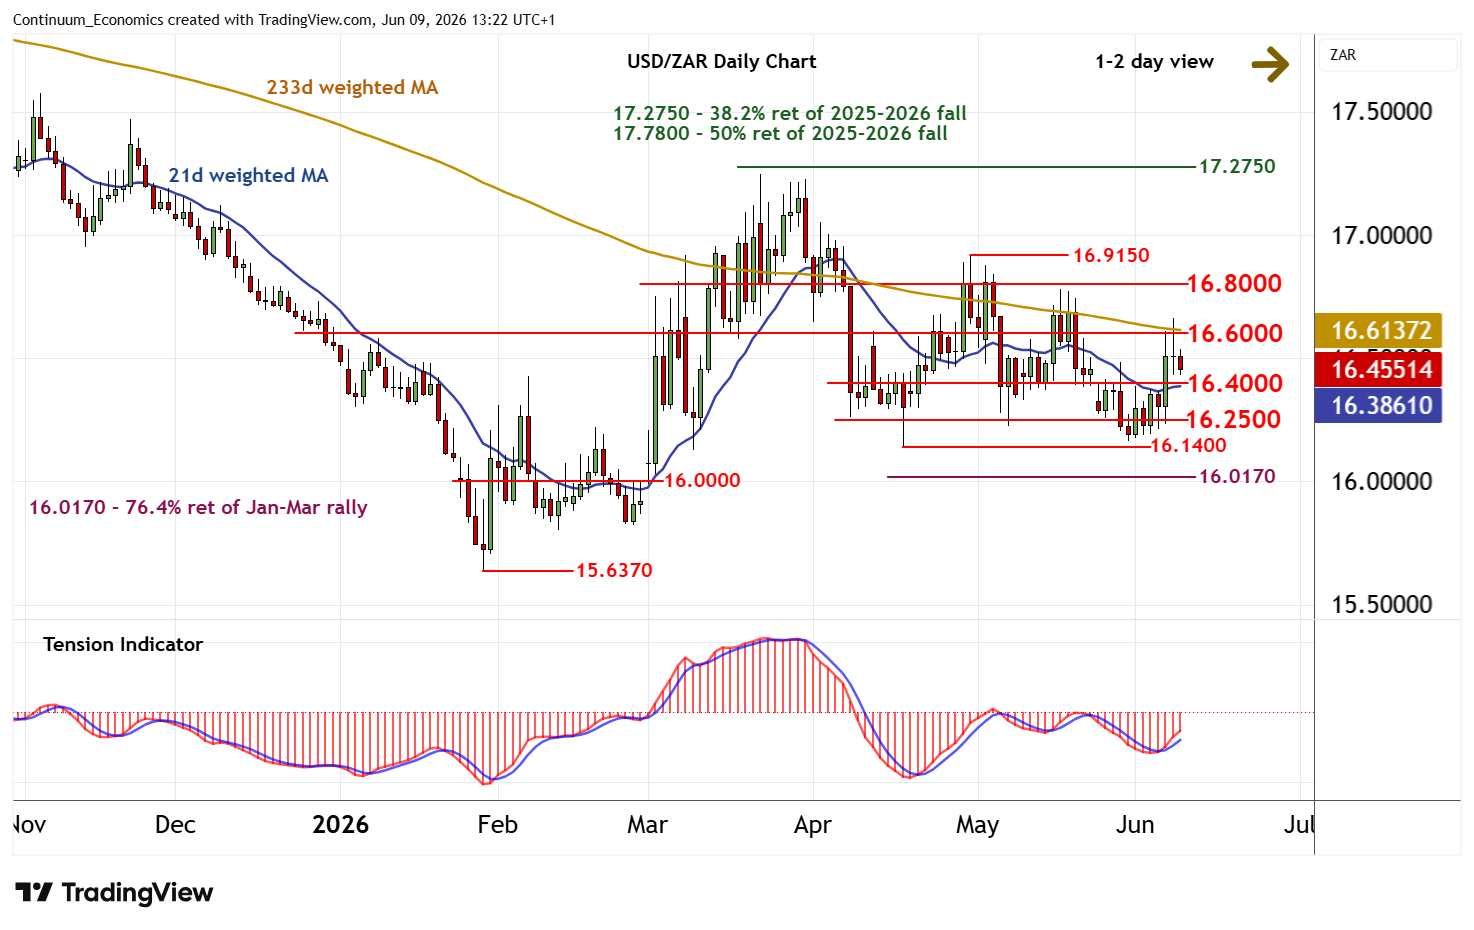
| Level | Comment | Level | Comment | |||||
|---|---|---|---|---|---|---|---|---|
| R4 | 16.9150 | ** | 30 Apr (w) high | S1 | 16.4000 | congestion | ||
| R3 | 16.8000 | * | congestion | S2 | 16.2500 | * | congestion | |
| R2 | 16.6630 | 8 Jun high | S3 | 16.1400 | ** | 17 Apr (m) low | ||
| R1 | 16.6000 | * | congestion | S4 | 16.0170 | ** | 76.4% ret of Jan-Mar rally |
Asterisk denotes strength of level
13:05 BST - The break higher has reached 16.6630, where negative intraday studies are prompting profit-taking and pullback into consolidation within the 16.4000 - 16.6000 range. A test of congestion support at 16.4000 cannot be ruled out. But rising daily readings should limit any break in renewed consolidation above further congestion around 16.2500. Meanwhile, an unexpected close above congestion resistance at 16.6000 will target 16.8000, where mixed/negative weekly charts should prompt renewed selling interest.