Published: 2026-11-19T14:38:53.000Z
Chart AUD/USD Update: Limited gains from fresh year low
1
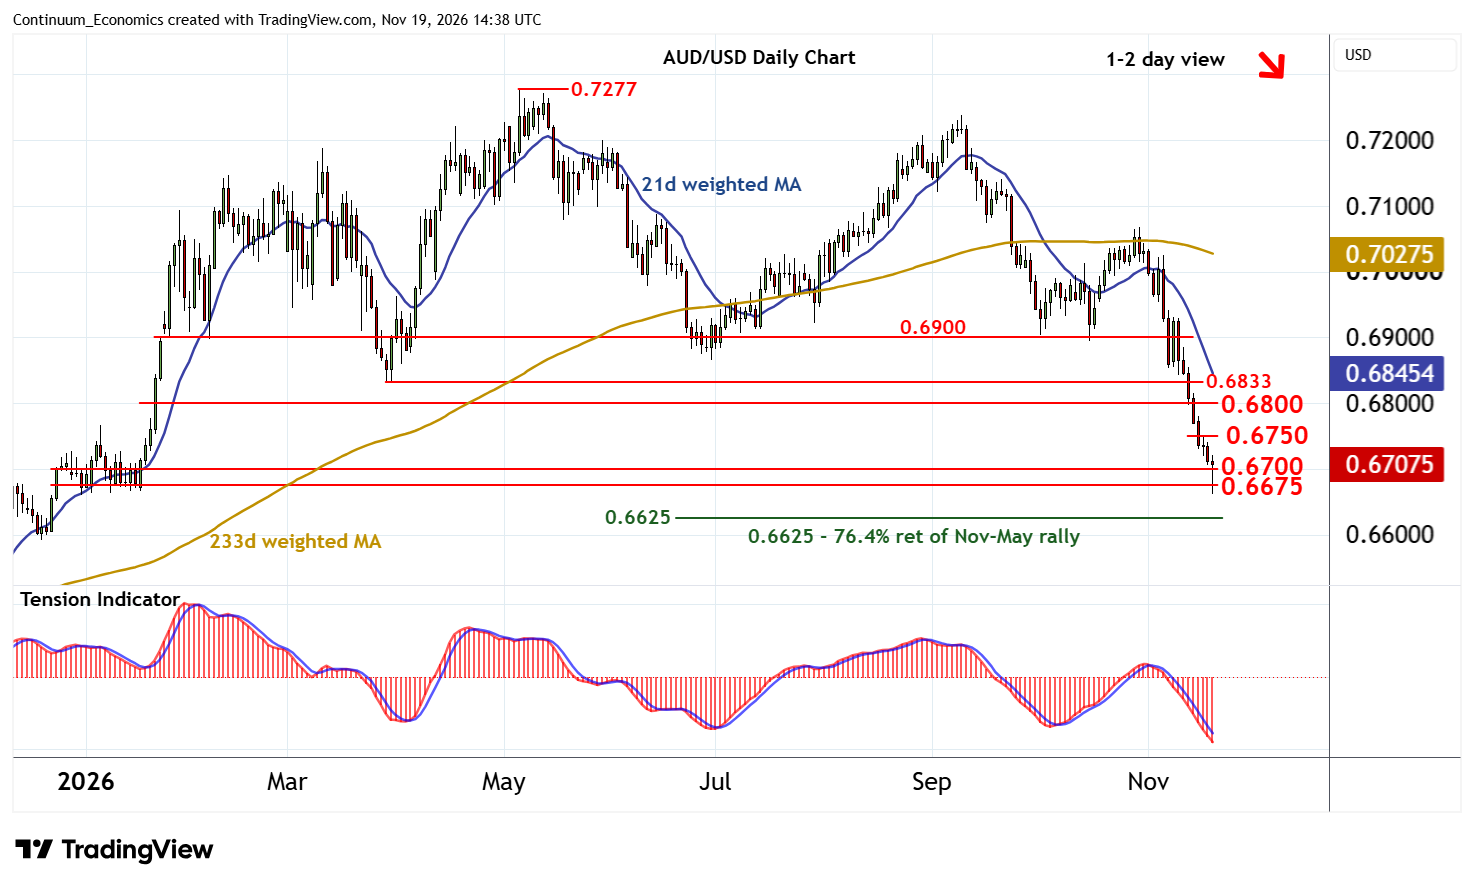
Anticipated losses have posted a fresh year low around 0.6660
| Levels | Imp | Comment | Levels | Imp | Comment | |||
|---|---|---|---|---|---|---|---|---|
| R4 | 0.6865 | ** | 30 Jun (m) low | S1 | 0.6700 | ** | congestion | |
| R3 | 0.6833 | ** | 30-31 Mar (m) lows | S2 | 0.6675 | * | January congestion lows | |
| R2 | 0.6800 | break level | S3 | 0.6660 | * | fresh year low | ||
| R1 | 0.6750 | break level | S4 | 0.6625 | ** | 76.4% ret of Nov-May rally |
Asterisk denotes strength of level
14:20 GMT - Anticipated losses have posted a fresh year low around 0.6660, before bouncing sharply into consolidation above congestion support at 0.6700. Rising intraday studies highlight room for continuation towards resistance at 0.6750. But negative daily readings and bearish weekly charts should limit any immediate tests in renewed selling interest/consolidation.
Following cautious/corrective trade, fresh losses are looked for. However, a close below support at the 0.6675 January congestion lows is needed to turn sentiment negative once again and extend losses from the 0.7277 current year high of 7 May towards the 0.6625 Fibonacci retracement.