Published: 2026-07-31T01:36:37.000Z
Chart EUR/JPY Update: Mirrors the April plunge
1
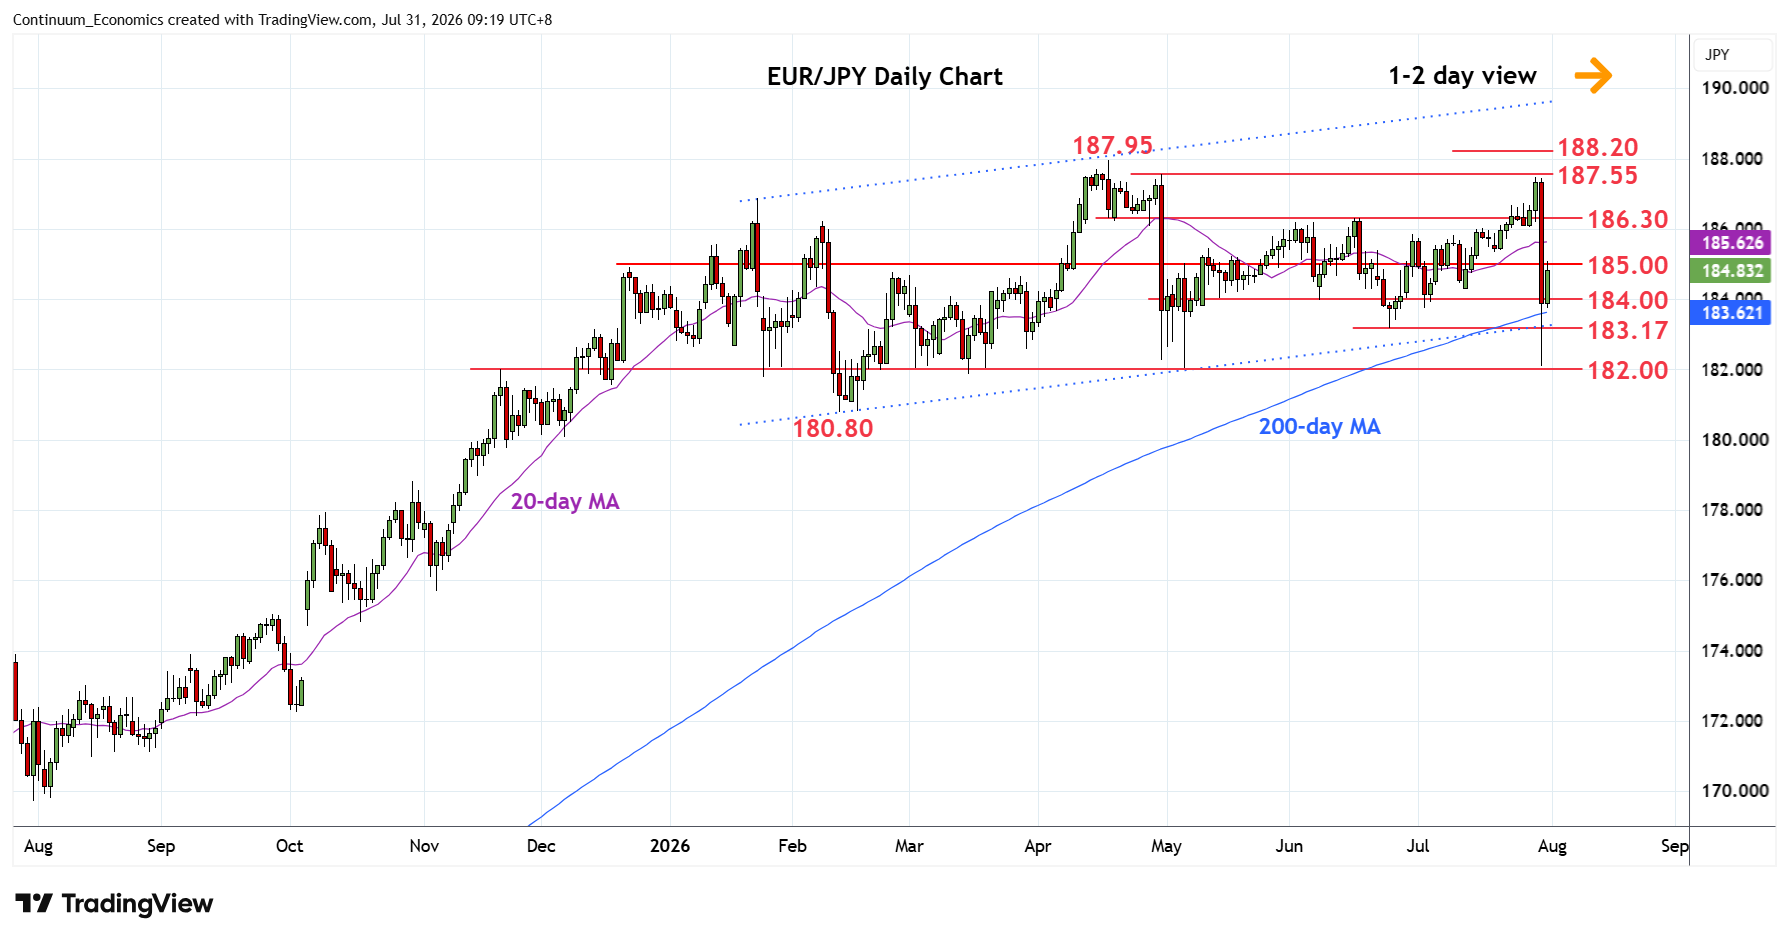
Consolidation below 187.55 resistance gave way to sharp plunge to mirror the 30 April losses
| Levels | Imp | Comment | Levels | Imp | Comment | |||
|---|---|---|---|---|---|---|---|---|
| R4 | 186.30 | ** | Jun high | S1 | 183.62 | * | 200-day MA | |
| R3 | 186.00 | * | congestion | S2 | 183.17 | * | Jun low | |
| R2 | 185.50 | * | congestion | S3 | 182.00 | ** | May low | |
| R1 | 185.00 | * | congestion | S4 | 180.80 | ** | 12 Feb YTD low |
Asterisk denotes strength of level
01:25 GMT - Consolidation below 187.55 resistance gave way to sharp plunge to mirror the 30 April losses. Subsequent bounce from the 182.10 low see prices back in consolidation above the 200-day MA at 183.62 to reach the 185.00 level. A replay of the late-April losses, if seen, will see room for choppy trade back to the 186.00/30 resistance. However, negative daily and weekly suggest this latest bounce should fall well short of the 186.00/30 resistance. Would take break of the 200-day MA and the June low at 183.17 to return focus to the downside for retest of 182.00 May low.