Published: 2026-11-19T00:25:39.000Z
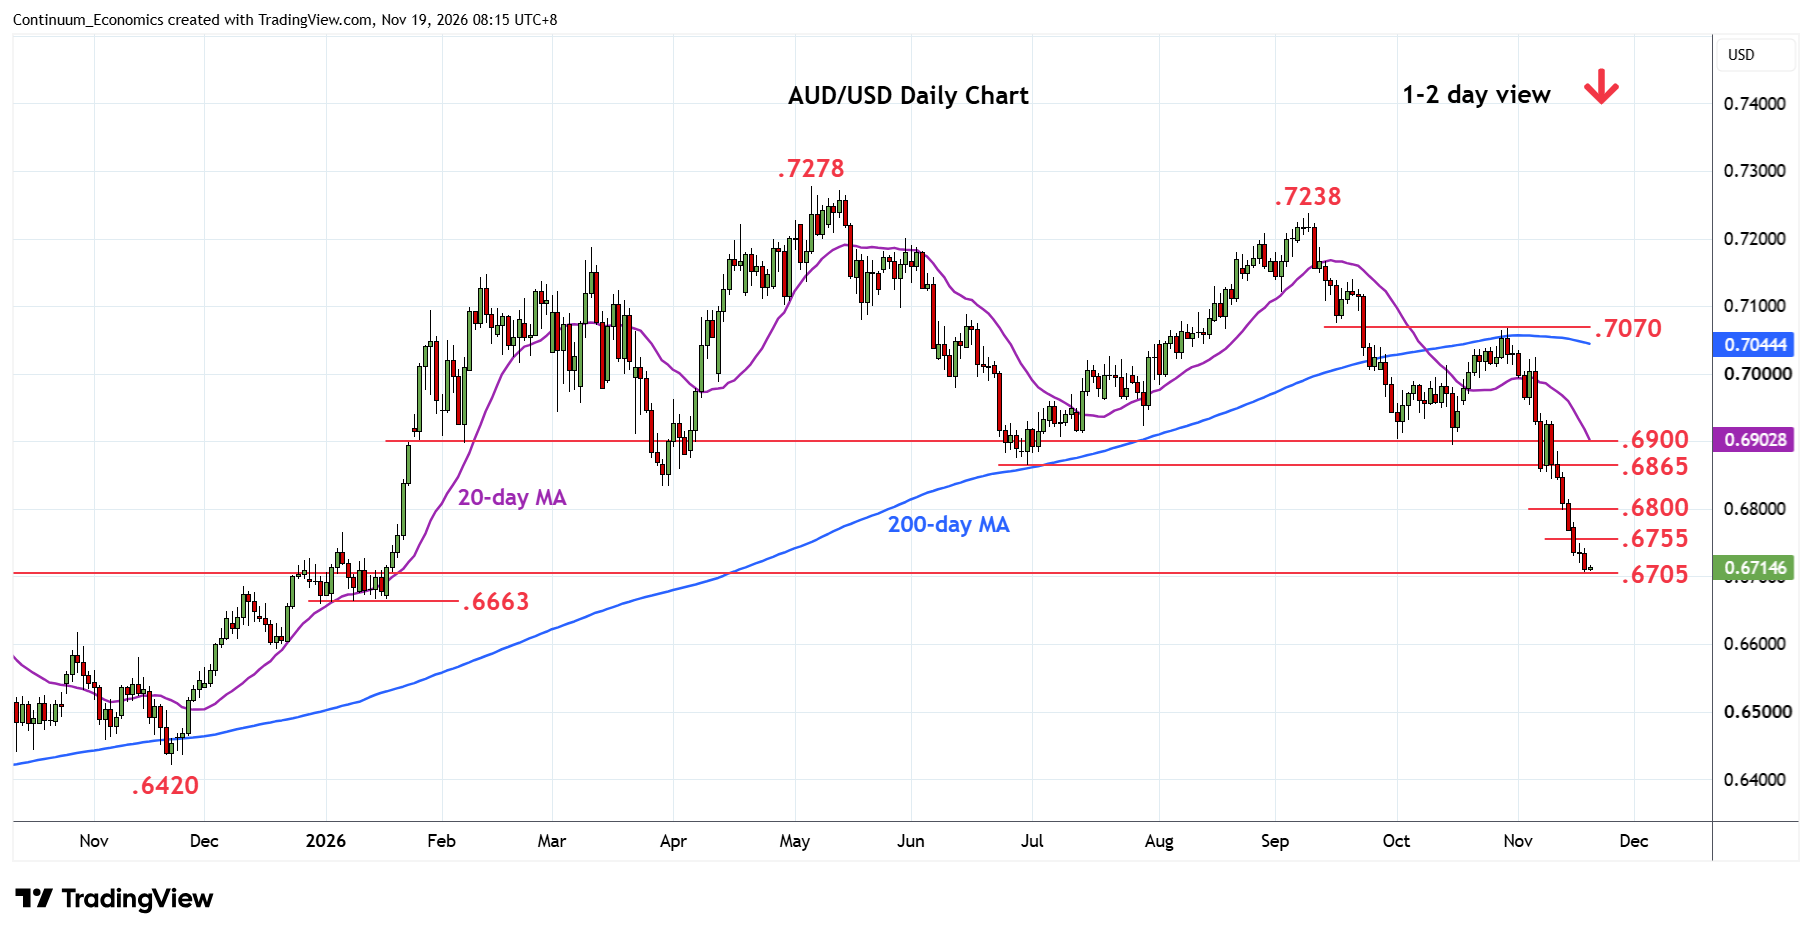
Chart AUD/USD Update: Weighing on .6705/00 support
-
Prices remain under pressure with fresh losses reaching the .6705/00 support before edging up in consolidation
| Levels | Imp | Comment | Levels | Imp | Comment | |||
|---|---|---|---|---|---|---|---|---|
| R4 | 0.6950 | * | congestion | S1 | 0.6705/00 | * | Sep 2025 high, congestion | |
| R3 | 0.6900 | ** | congestion, Oct low | S2 | 0.6663 | ** | 5 Jan YTD low | |
| R2 | 0.6865 | ** | Jun low | S3 | 0.6600 | * | congestion, 50% | |
| R1 | 0.6755/00 | * | congestion | S4 | 0.6550 | * | congestion |
Asterisk denotes strength of level
00:15 GMT - Prices remain under pressure with fresh losses reaching the .6705/00 support before edging up in consolidation as prices unwind oversold intraday studies. Daily and weekly studies are stretched but bearish pressure keep focus on the downside and further losses cannot be ruled out. Lower, will see room to the 5 January current year low at .6663 then the .6600, 50% Fibonacci retracement. Meanwhile, resistance remains at the .6755/.6800 congestion area. Would need lift over these to eased the downside pressure and open up room for stronger corrective bounce.