Chart GBP/USD Update: Sharp reversal in heightened volatility
Choppy trade beneath resistance at the 1.3470 Fibonacci retracement has given way to a sharp fall
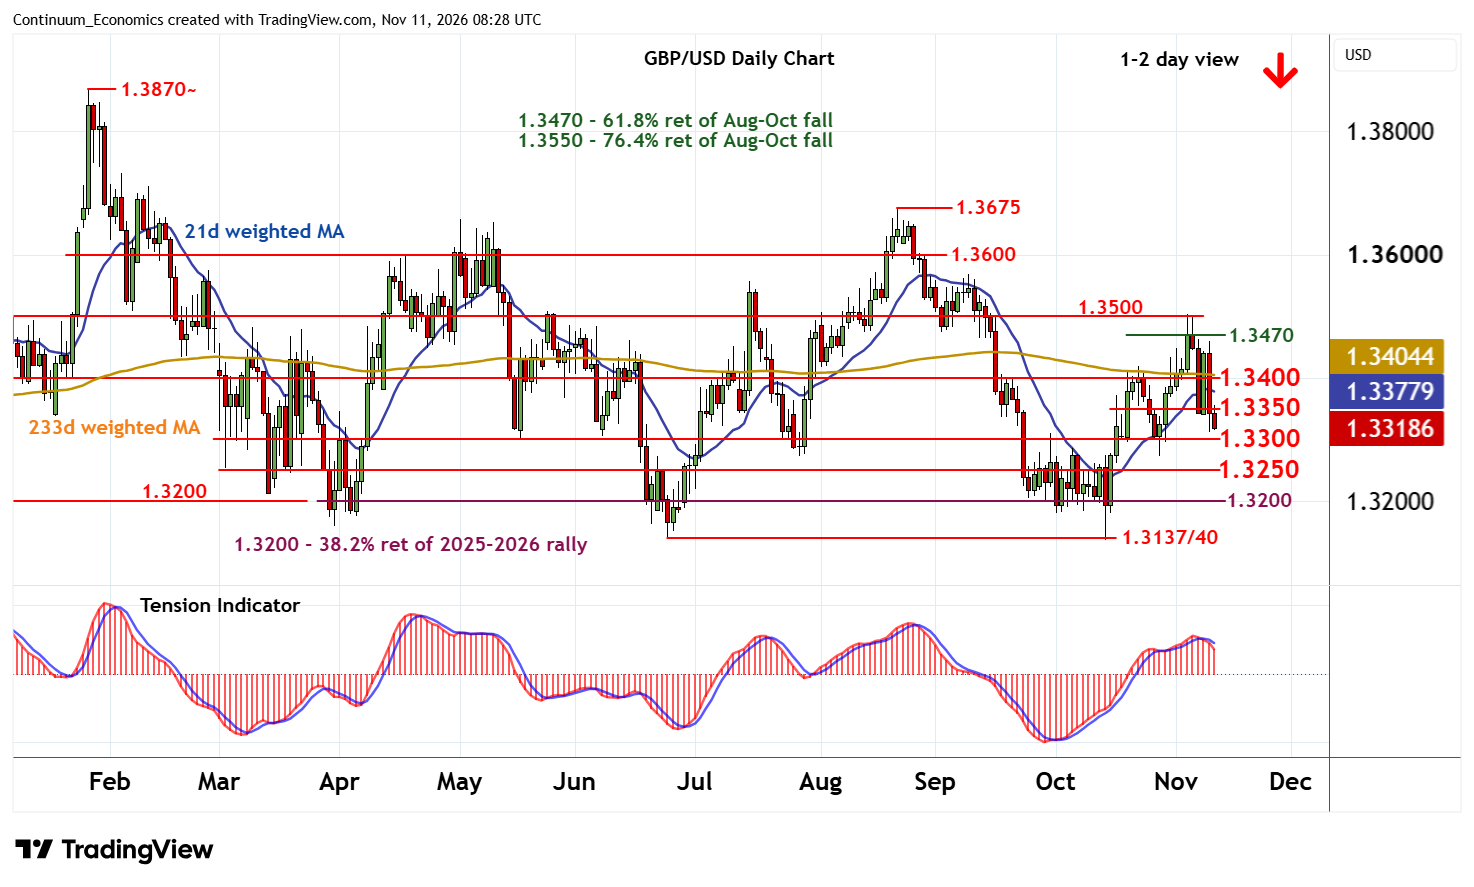
| Level | Comment | Level | Comment | |||||
|---|---|---|---|---|---|---|---|---|
| R4 | 1.3500 | ** | congestion | S1 | 1.3300 | ** | congestion | |
| R3 | 1.3470 | ** | 61.8% ret of Aug-Oct fall | S2 | 1.3250 | * | congestion | |
| R2 | 1.3400 | ** | congestion | S3 | 1.3200 | ** | congestion, 38.2% ret | |
| R1 | 1.3350 | break level | S4 | 1.3137/40 | ** | Jun-Oct YTD lows |
Asterisk denotes strength of level
08:10 GMT - Choppy trade beneath resistance at the 1.3470 Fibonacci retracement has given way to a sharp fall, with focus turning to congestion support at 1.3300 in heightened volatility. Intraday studies have turned down and daily readings are also deteriorating, highlighting room for continuation beneath here towards further congestion around 1.3250. However, daily stochastics are approaching oversold areas, suggesting any initial tests could be limited in consolidation/range extension, before deteriorating weekly charts prompt further losses.
Meanwhile, resistance is lowered to 1.3350. A close above here, if seen, will help to stabilise price action and prompt consolidation beneath 1.3400.