Chart USD Index DXY Update: Back in range - background studies under pressure
The break below 99.50 has not been sustained
| Levels | Imp | Comment | Levels | Imp | Comment | |||
|---|---|---|---|---|---|---|---|---|
| R4 | 101.00 | * | congestion | S1 | 99.50 | ** | congestion base | |
| R3 | 100.75 | congestion | S2 | 99.20 | ** | 61.8% ret of Apr-Jun rally | ||
| R2 | 100.35 | ** | 15 Jul (w) low | S3 | 99.00 | ** | congestion | |
| R1 | 100.00 | ** | congestion | S4 | 98.60 | ** | 76.4% ret of Apr-Jun rally |
Asterisk denotes strength of level
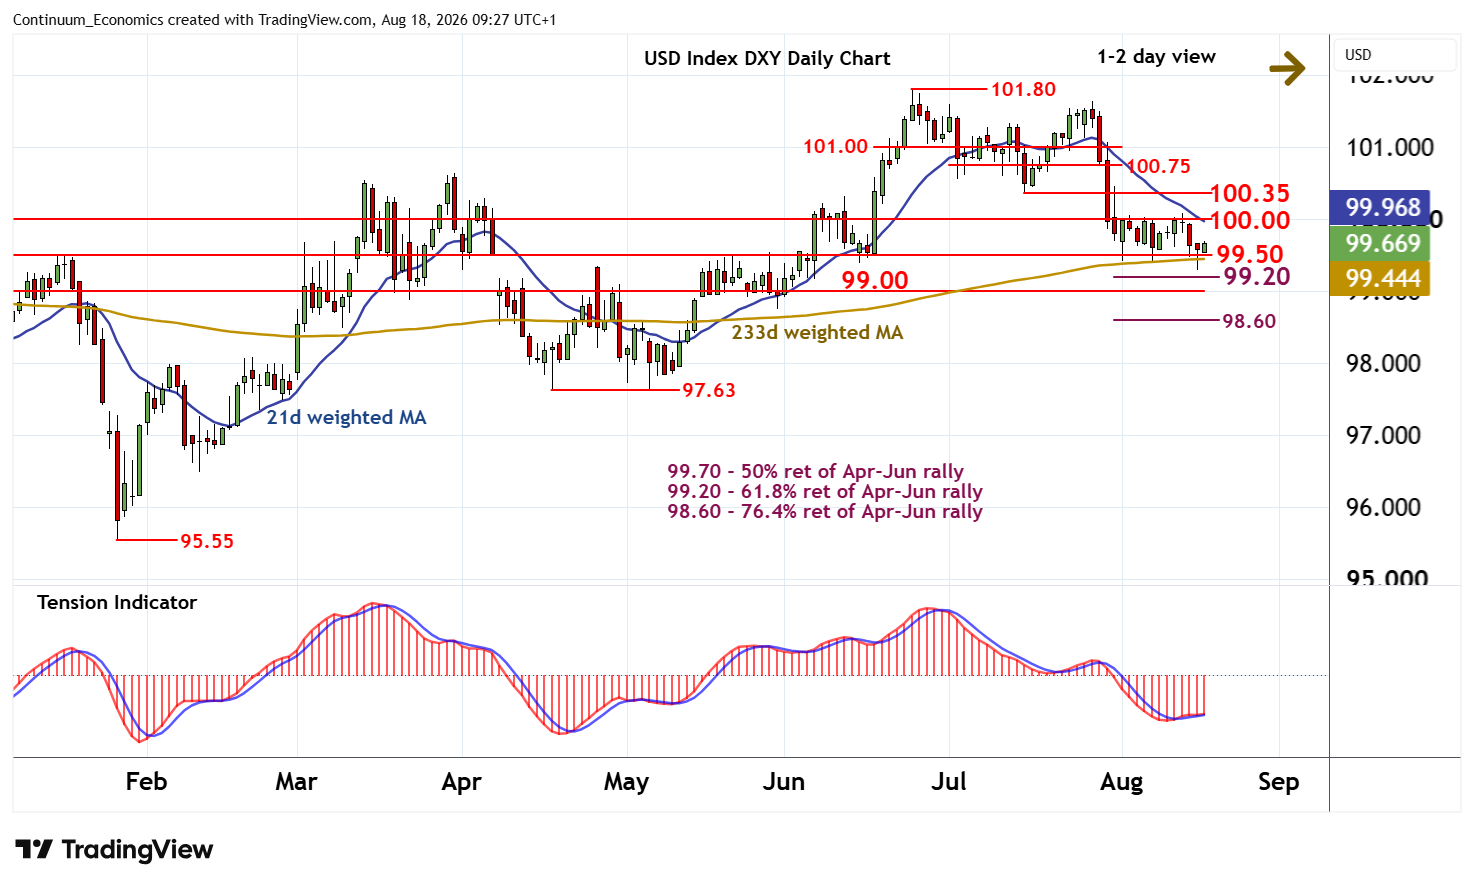
09:05 BST - The break below 99.50 has not been sustained, as rising intraday studies prompt a bounce from 99.30 back into consolidation above 99.50. Daily stochastics are turning higher, suggesting room for continuation towards congestion resistance at 100.00. But the flat daily Tension Indicator and bearish weekly charts should limit any further gains in renewed selling interest beneath the 100.35 weekly low of 15 July.
Following range extension, fresh losses are looked for. A close back below 99.50 will add weight to sentiment. But a further close below the 99.20 Fibonacci retracement is needed to turn sentiment negative and confirm continuation of late-June losses. Focus will then turn to congestion around 99.00, ahead of the 98.60 resistance.