Published: 2026-08-07T01:29:34.000Z
Chart EUR/JPY Update: Extending corrective bounce
2
Break above 182.00 has see prices retracing losses from the 187.47 high of 29 July
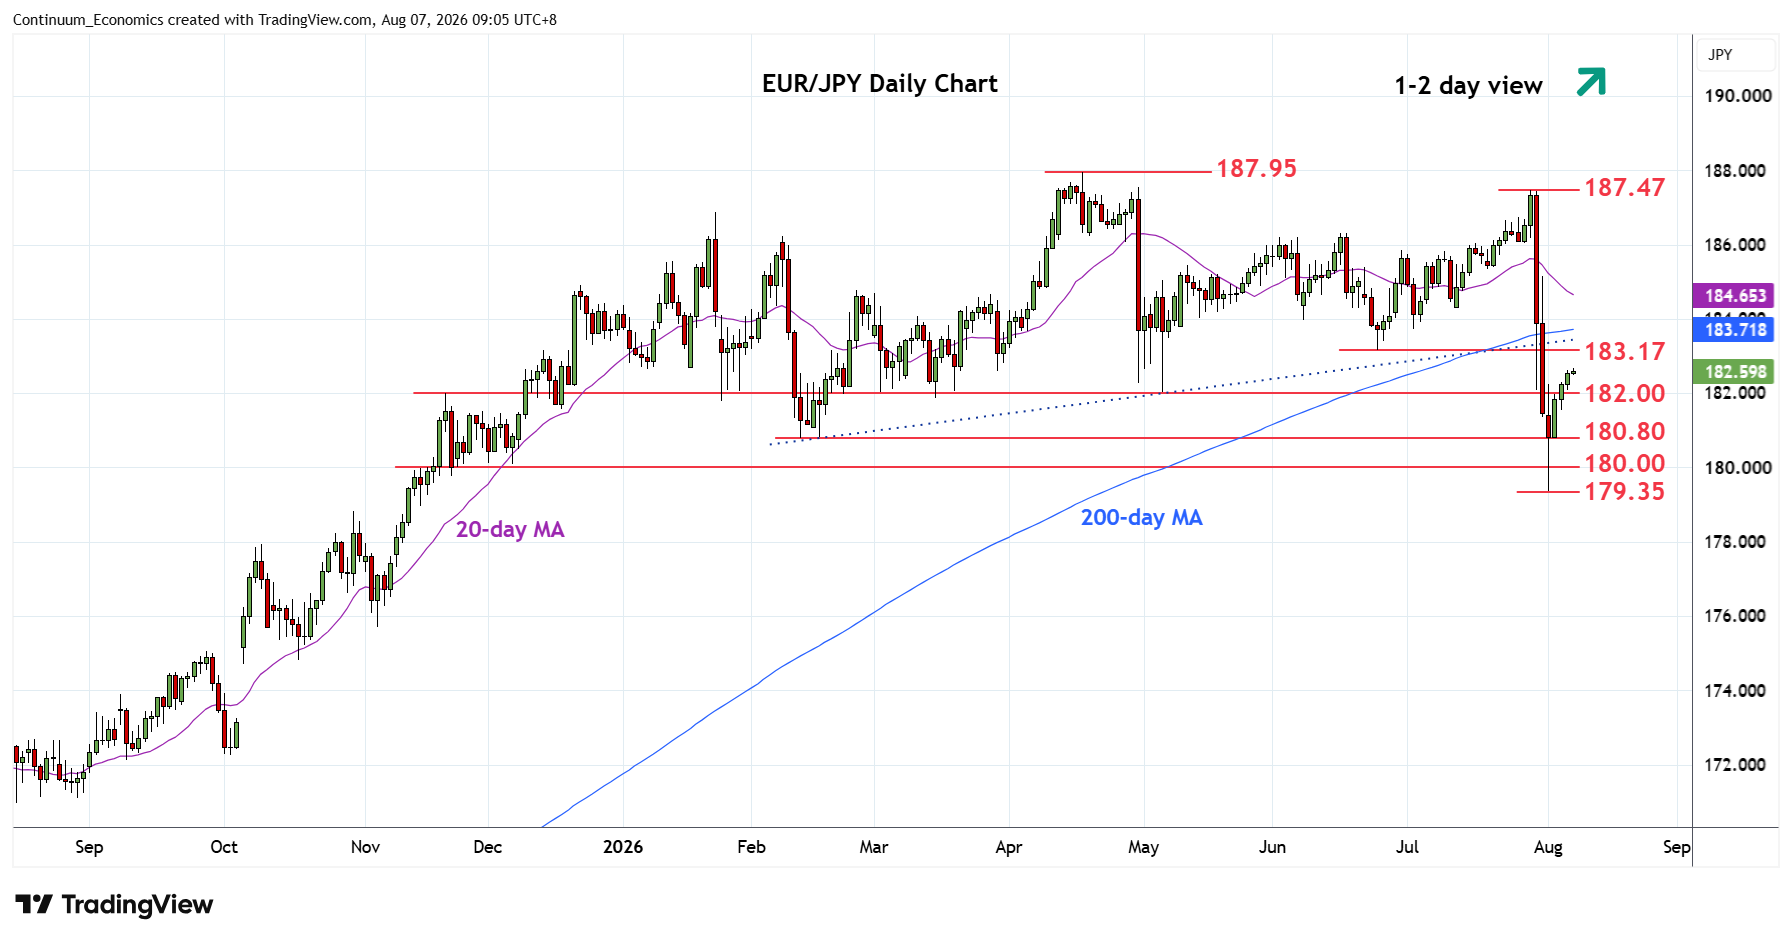
| Levels | Imp | Comment | Levels | Imp | Comment | |||
|---|---|---|---|---|---|---|---|---|
| R4 | 183.70 | * | 200-day MA | S1 | 182.00 | * | congestion, May low | |
| R3 | 183.40 | * | 50% Jul/Aug fall | S2 | 180.80 | * | congestion | |
| R2 | 183.17 | ** | Jun low | S3 | 180.00 | * | congestion | |
| R1 | 183.00 | * | congestion | S4 | 179.35 | ** | 3 Aug YTD low |
Asterisk denotes strength of level
01:20 GMT - Break above 182.00 has see prices retracing losses from the 187.47 high of 29 July. Intraday and daily studies are unwinding oversold readings and break above the 38.2% Fibonacci level at 182.45 opens up room to strong resistance at the 183.17 June low which is expected to cap. Corrective gains are expected to give way to renewed selling pressure later. Below the 182.00 level will see room for extension to retest the 180.80 support. Break here will return focus to the downside for retest of the 180.00 level and 179.35, August current year low.