Published: 2026-06-19T01:09:24.000Z
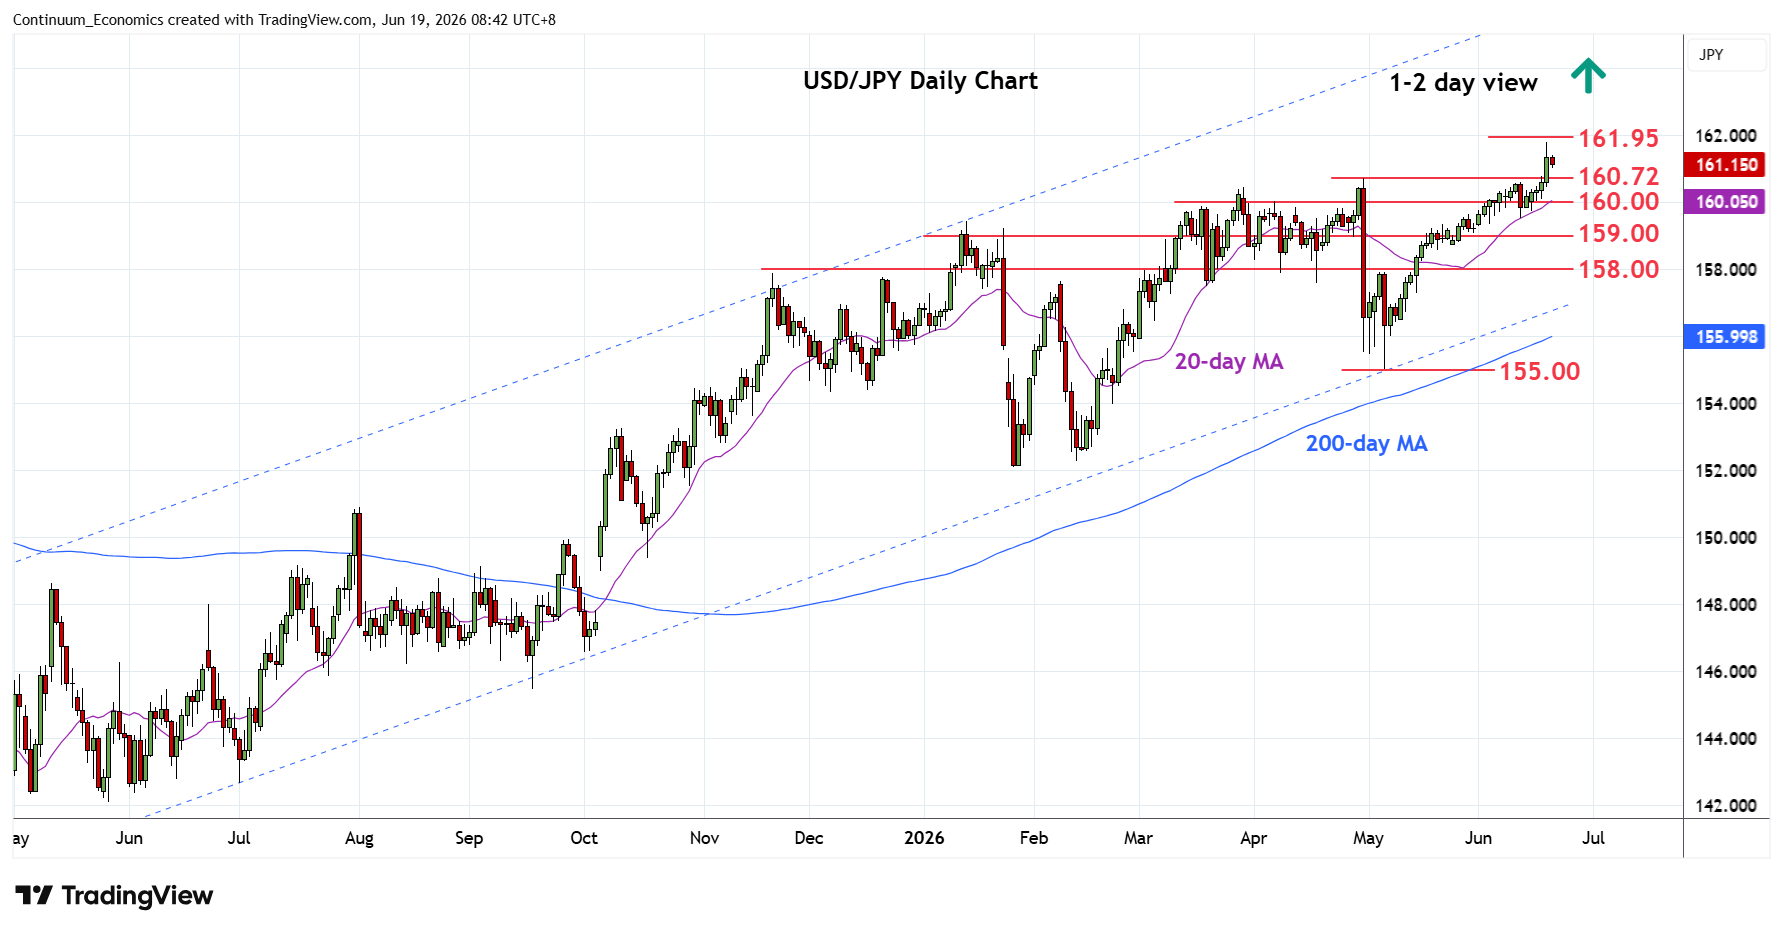
Chart USD/JPY Update: Just shy of 2024 multi-year high
-
Pushed to fresh year high has met with selling pressure at 161.80 high
| Levels | Imp | Comment | Levels | Imp | Comment | |||
|---|---|---|---|---|---|---|---|---|
| R4 | 164.00 | * | Dec 1986 high | S1 | 160.72 | * | 30 Apr high | |
| R3 | 163.00 | * | congestion Dec 1986 | S2 | 160.00 | * | figure | |
| R2 | 161.95 | ** | Jul 2024 multi-year high | S3 | 159.53 | * | 11 Jun low | |
| R1 | 161.80 | ** | 18 Jun YTD high | S4 | 159.00 | * | congestion |
Asterisk denotes strength of level
01:00 GMT - Pushed to fresh year high has met with selling pressure at 161.80 high. Consolidation below this see support starting at the 160.72 late-April high and extending to the 160.00 figure. This area expected to underpin and keep pressure on the upside to extend gains from the 155.00 May low. Break will ease the upside pressure and open up room for deeper pullback to 159.53/159.00 area. Meanwhile, focus remains on the 161.80/95 highs and break here will extend gains to fresh multi-year high.